Time-Intensity Plots
For Voyager 1 and 2
26-Day Averages
1-Day Averages
Interactive Plots
Heliopause Crossings
Spectra Plots
Select type of SpectraHome
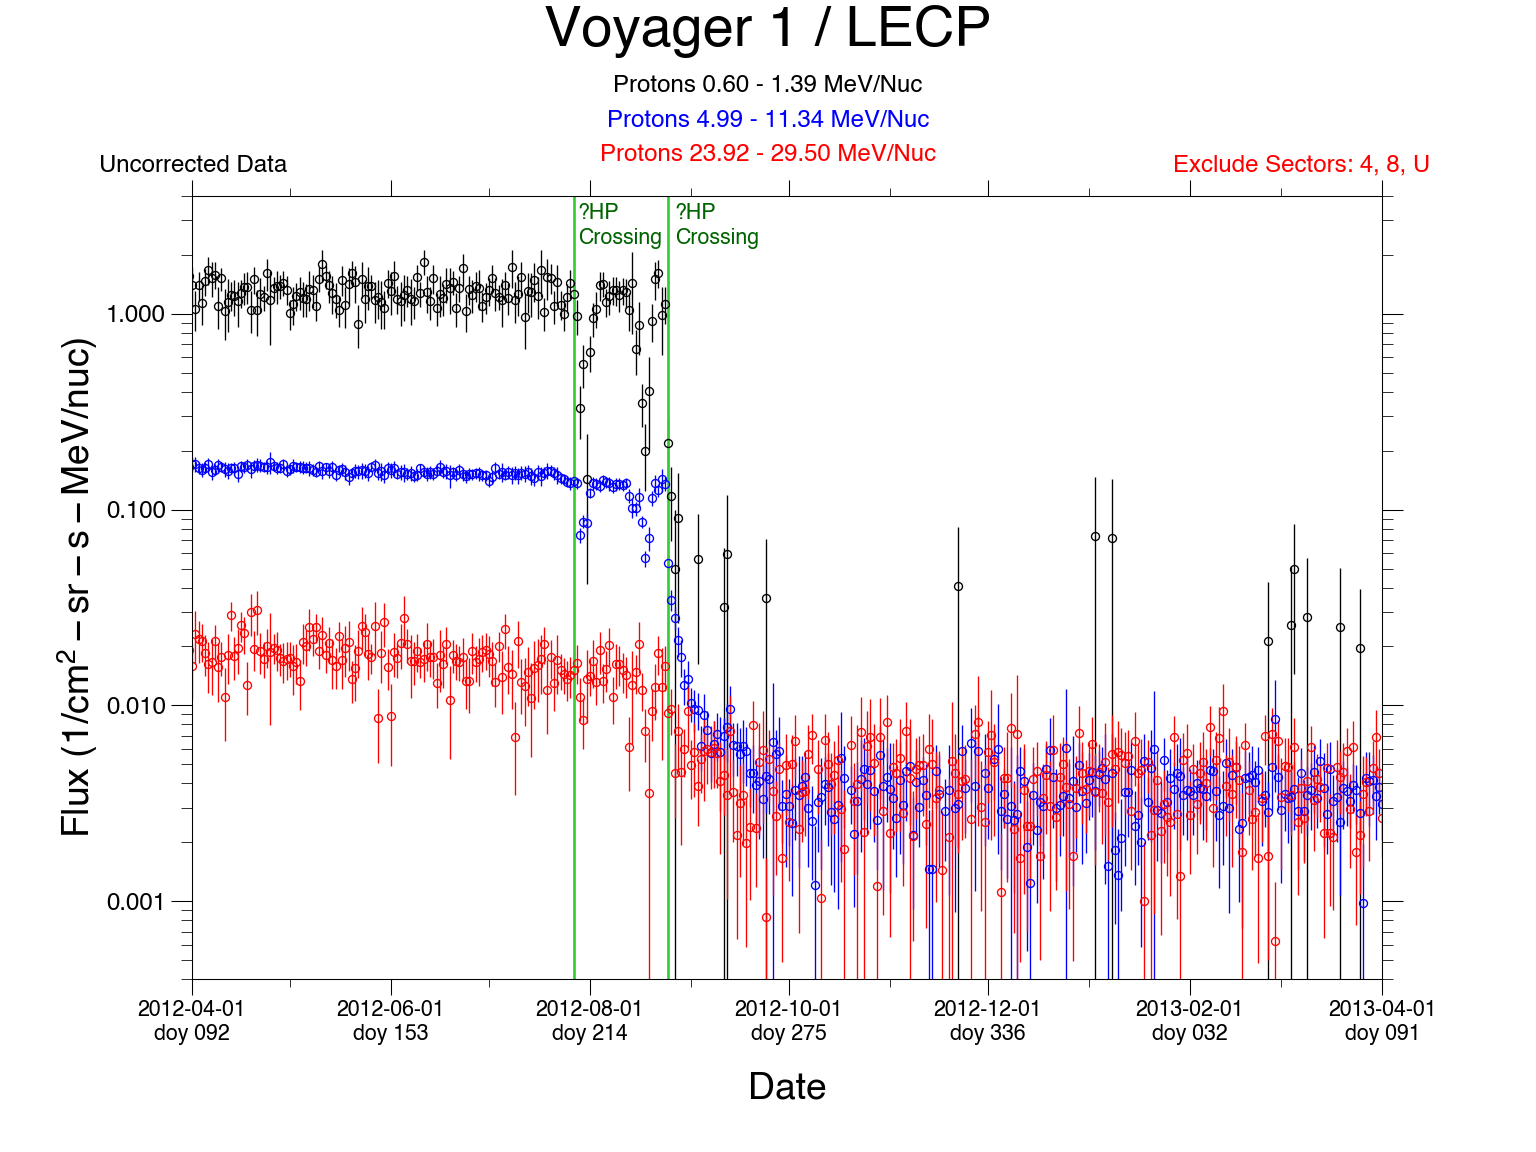
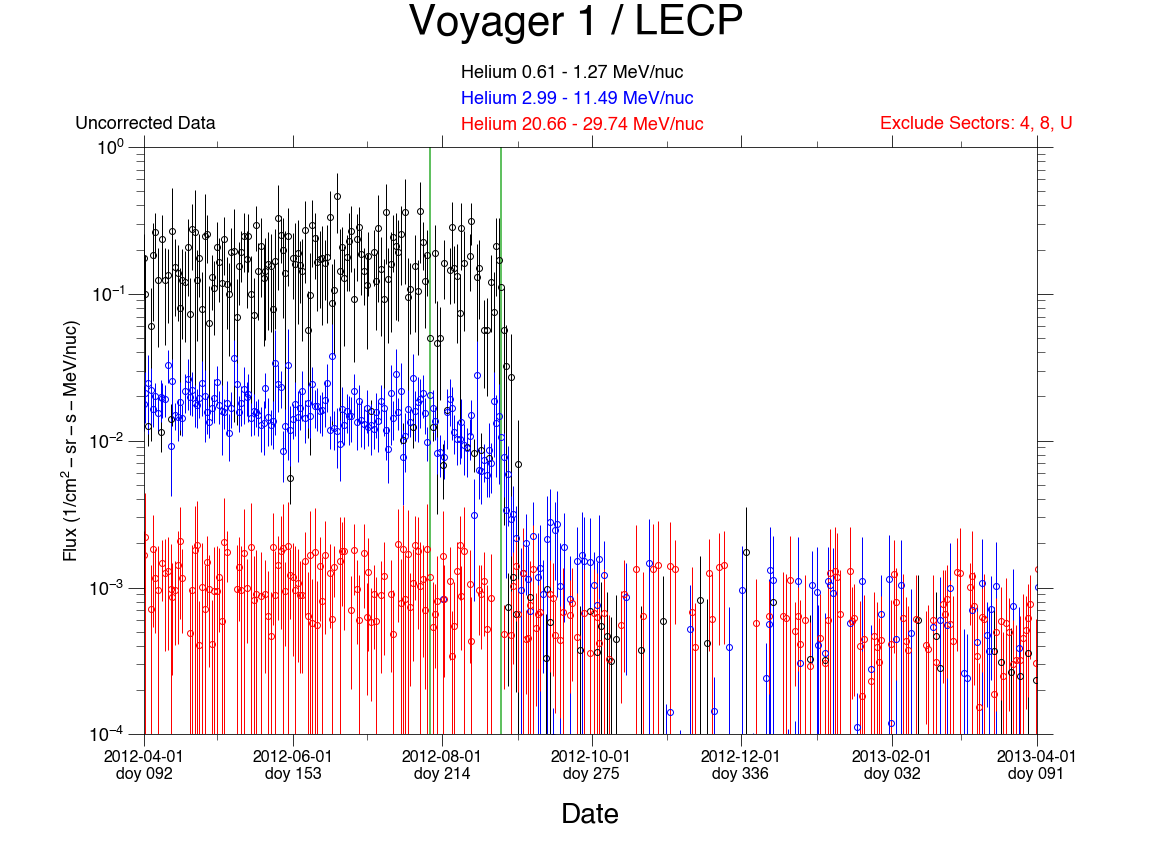
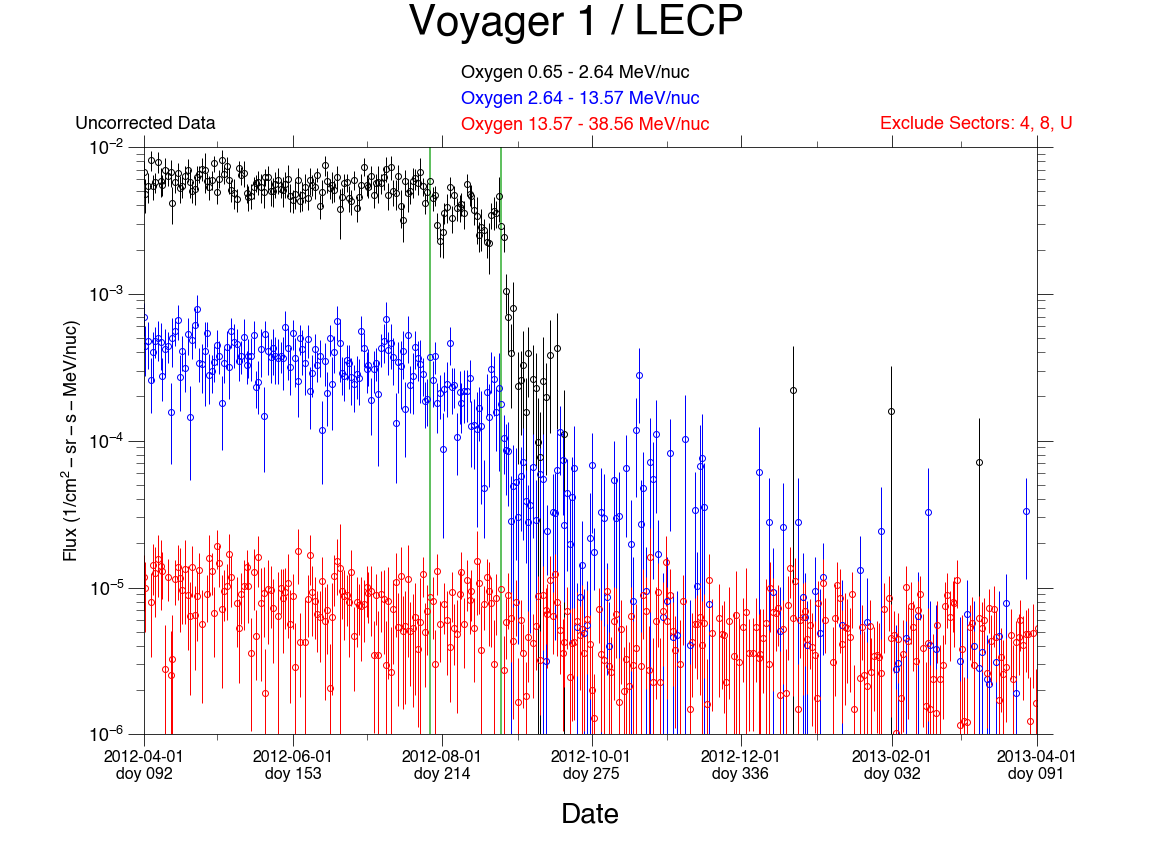
Voyager 1 & 2 LECP Heliopause Crossings
University of Maryland Space Physics Group
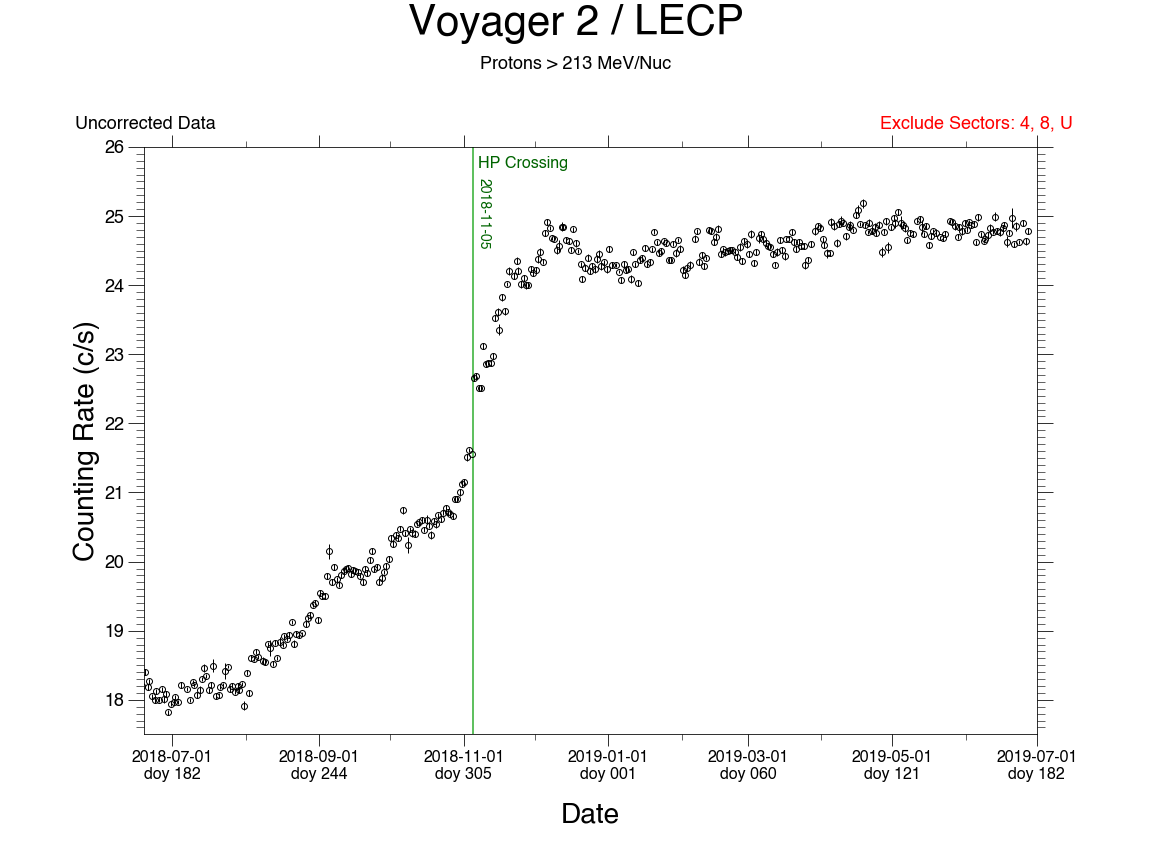
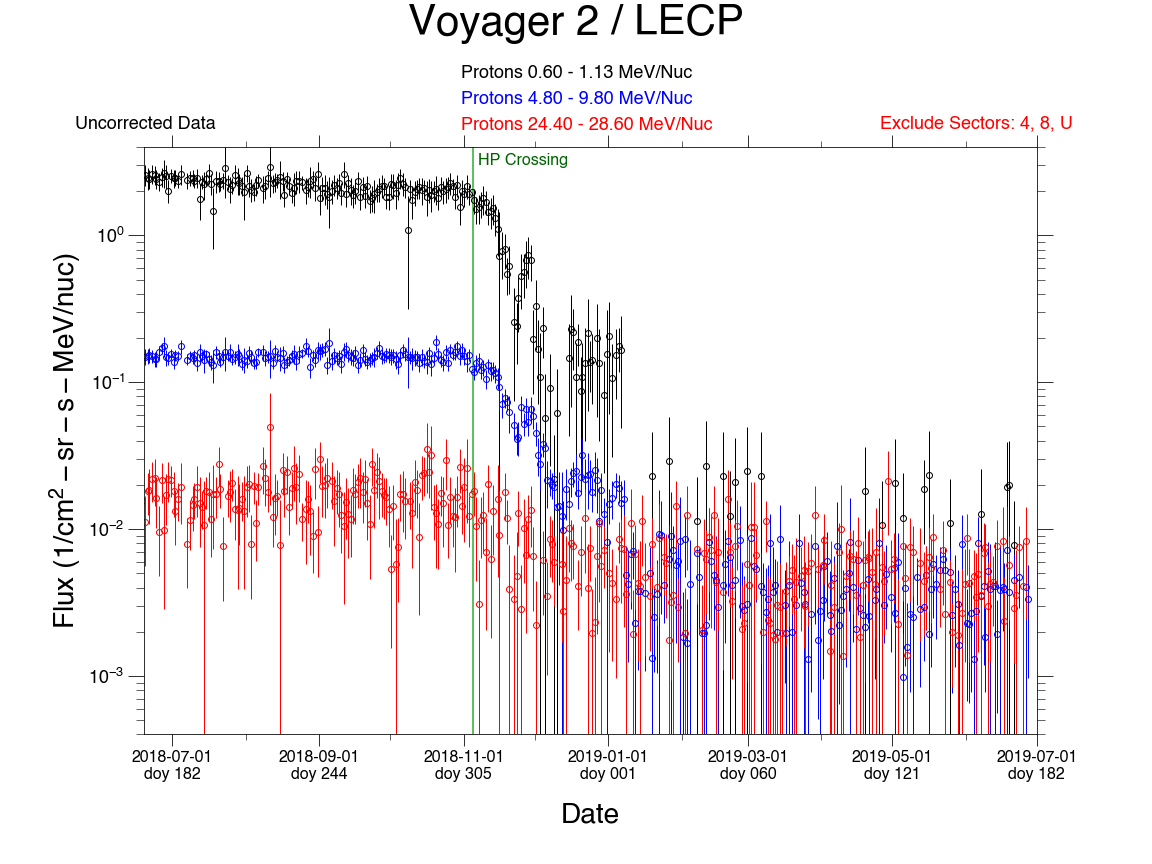
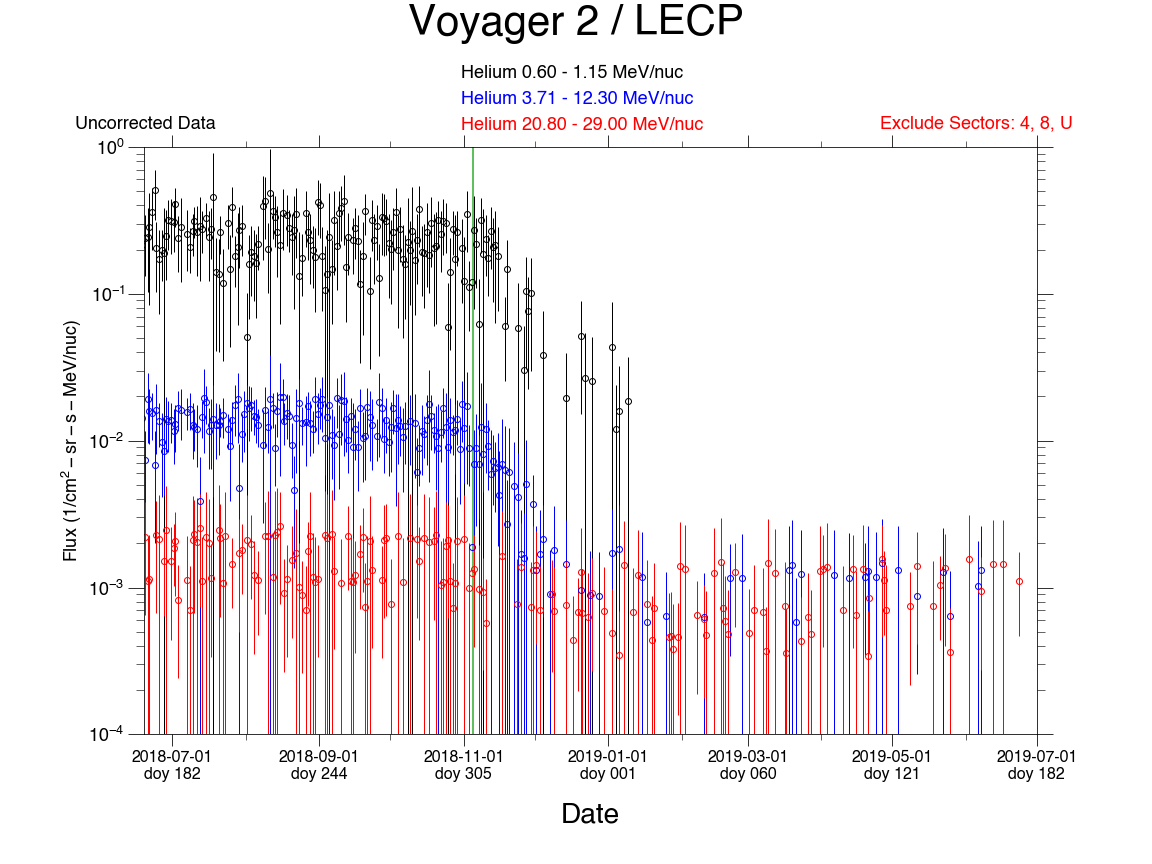
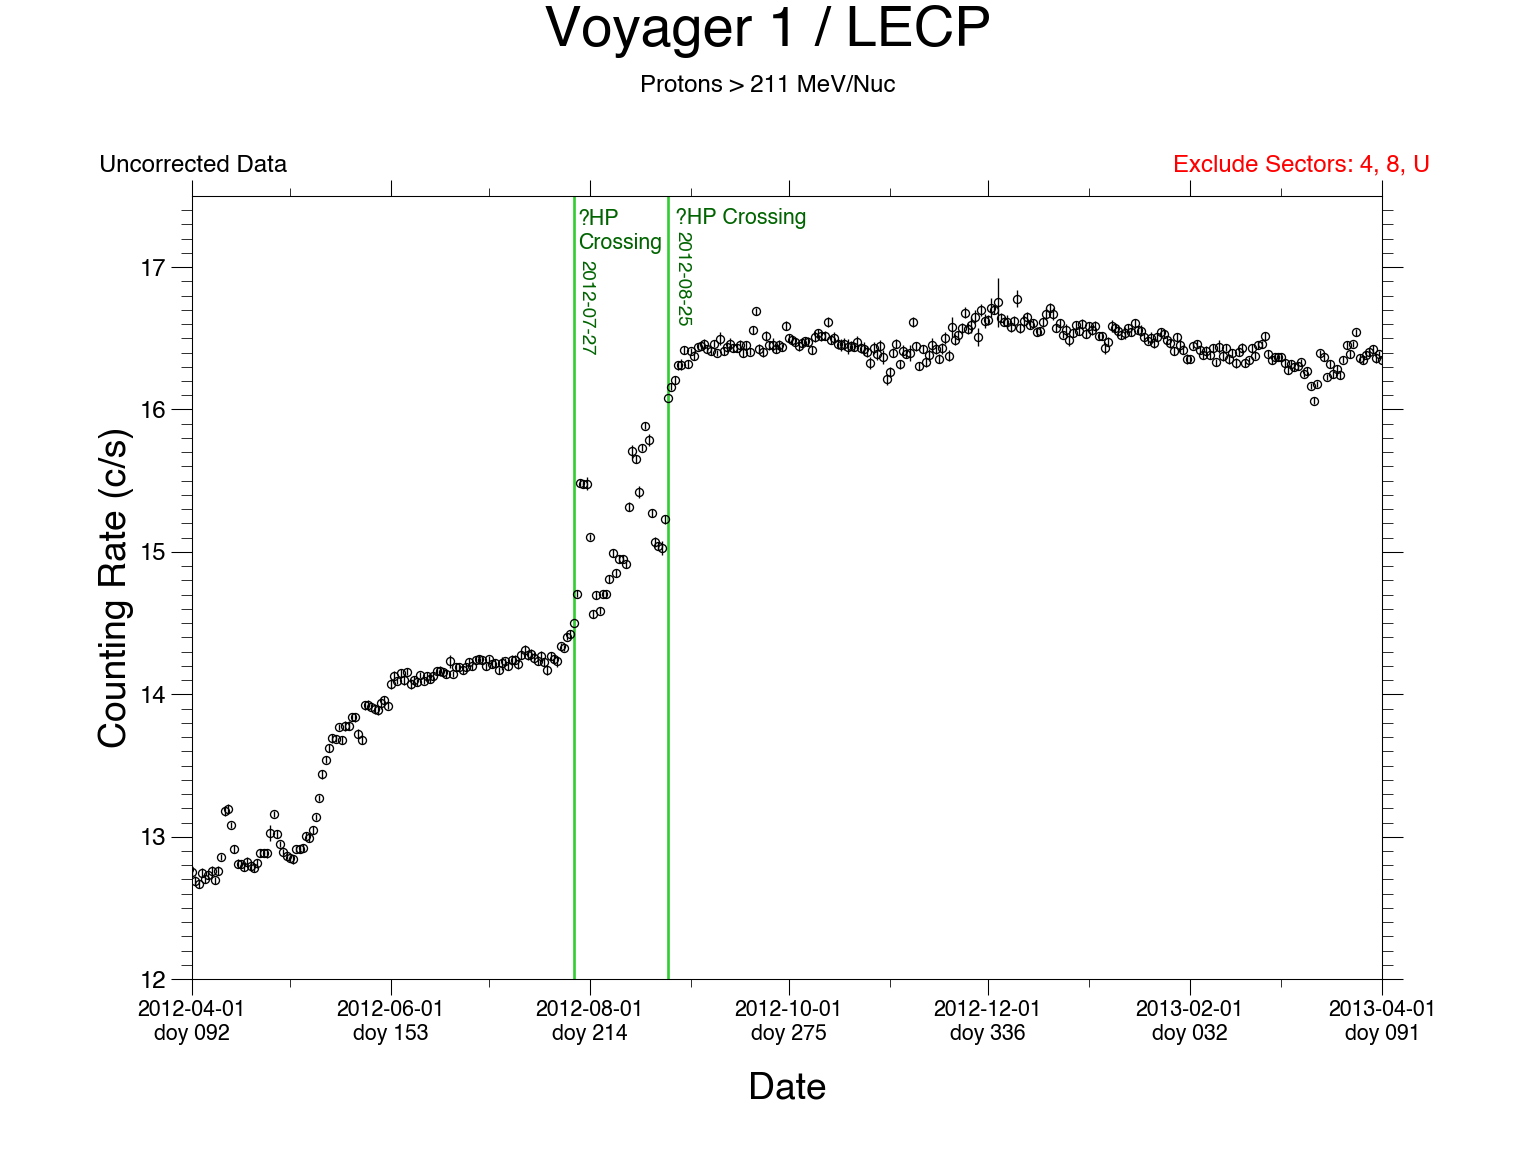
Daily averages of GCRs (> 213 MeV) and lower energy protons from LECP on Voyager 2 are shown on the left side for the 1 year period around its Nov 5, 2018 heliopause crossing. Similar data from Voyager 1 are shown on the right side for the 1-year period around its Aug 25, 2012 heliopause crossing.
V2 last updated: Jul 01, 2019
(Click on a plot to enlarge)

This Voyager LECP website is maintained by the
University of Maryland Space Physics Group
Scientific contact: Douglas C. Hamilton
Software maintenance: Scott Lasley