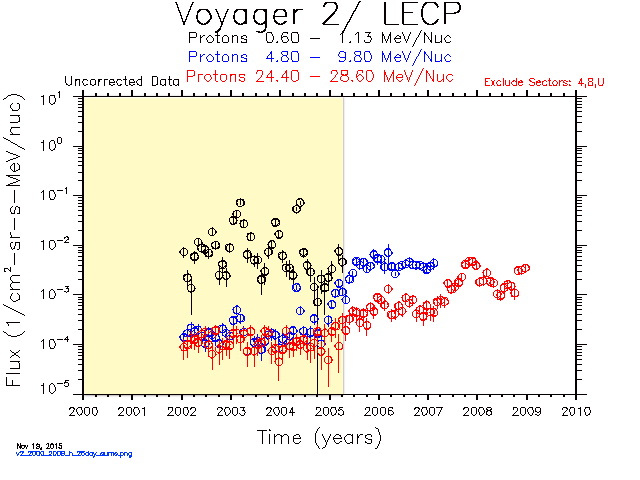
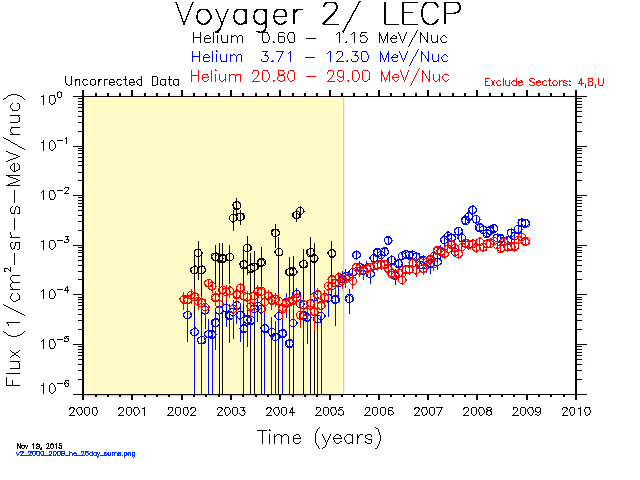
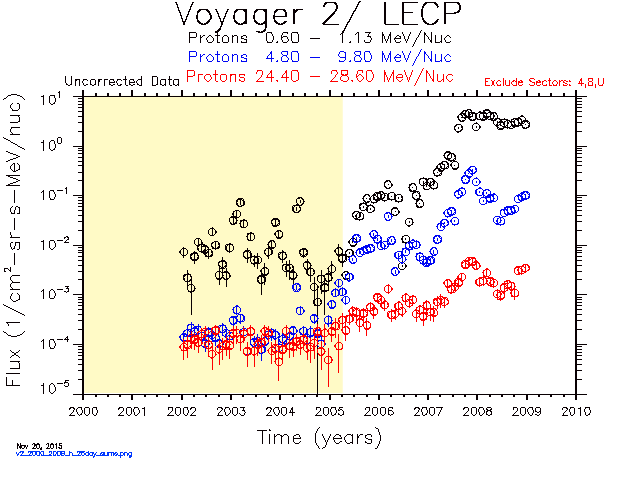
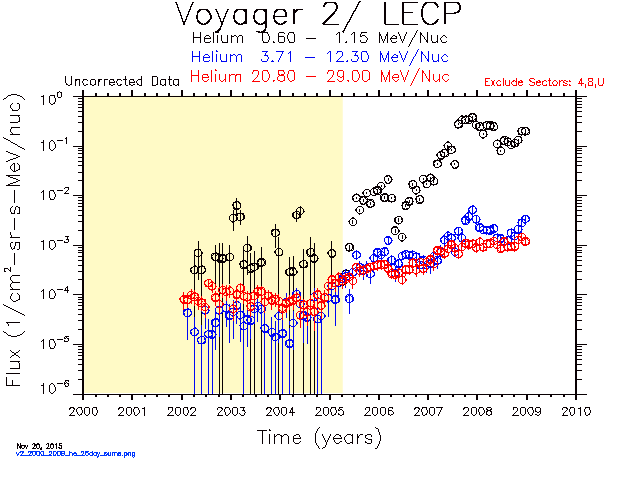
Voyager 2 PHA Change in April, 2005
A LECP discriminator on Voyager 2 failed on April 6, 2005 causing some events to be assigned to the wrong rate channel. The change is obvious in the dropout of low energy H and He after 2005 day 96 in the time-intensity plots generated with the ivf file from 1996. Rate boxes for some elements were added to the ivf file in 2012 in an attempt to recover ch1, ch3, and ch4. The H and He plots look better, but the low energy fluxes for C, N, O and Ne are lower than expected after 2005 as shown in the yearly spectra plots.
This ipython notebook describes the technique used to find any rate boxes that should be added to the 2012 ivf file to process all PHAs for H, He, C, N, O and Ne. The process uses raw PHA data from the yearly .filt files and the fluxbox geometries from the ivf files. This notebook and some support files are bundled into this zip archive so you can run the code yourself.
- Step 1: Dump the raw phas from the yearly .filt files to text files using dump_phas.py
- Step 2: Read the text files from step 1 and create a pandas Dataframe containing PHA data for 1/1/1991 to 10/12/2014 with columns D1D5, D2, D3, D4, Sector, PHAID, PHAID_octal, Date
- Step 3: Define a few variables and functions useful for processing the PHA data
- Step 4: Read the dataframe into the phasdf variable and set up an array of start times for the yearly counts. Remove PHAs from sector 8 since it has the alpha source and PHAs with rate ids 27, 28, 29 and 30 since PHAs with these rate ids cover many fluxboxes with useless background counts according to the plots in step 7.
- Step 5: Create text and excel files containing the number of PHAs in each flux box for oxygen, carbon, nitrogen, hydrogen, neon, and helium.
- Select each line from an ivf file with a unique detector pair and set of IX and IY fluxbox limits for a given element
- For each fluxbox above, select the PHAs within the limits of the box and within the min and max ratebox limits for the 4 detectors
- Count the number of PHAs with each rate id in the PHAs above for each year and write the counts to files
Step 6: Read the dataframe into the phasdf variable and set up an array of start times for the yearly counts.
Step 7: Plot PHAs and flux boxes for D2 vs D1D5, D4 vs D1D5 and D2 vs D3 and save to png and pdf files.
- Select all PHAs with any of the octal values for a given rate that are within the 4 detector limits for the rate and within the date range of interest
- Plot a 2D histogram of the PHAs for the detector pair specified. Alternately, plot a scatter plot of the PHAs for the detector pair.
- Draw the fluxbox boundaries obtained from an ivf file on the plot.
- Save a png and pdf version of the plot
This zip file contains the spreadsheets generated in step 5 with yearly trends of PHA counts in the various rate boxes. This powerpoint file contains plots of 2-d D1D2 histograms from step 7 before and after April, 2005. This zip archive contains Keynote files showing the cummulative sums of the PHAs for the rates of interest before and after April, 2005. The spreadsheets and plots were used to decide which rate boxes to add to the ivf file in 2015.
The latest ivf file has been used to generate the databases and plots on the Voyager web site since April 2015. This comparison of the yearly spectra plots generated with the old and new ivf files shows an improvement in the low energy fluxes of C, N, O and Ne after 2005.
last modified 02:21 11/24/2015
import pandas as pd
"""Short snippet to read the output of dump_phas.py into a
pandas dataframe, create a usable date column and save to a file"""

# read the output of dump_phas.py
filnam = 'V2_phas_noch31/v2_1991_noch31.txt'
df = pd.read_csv(filnam, sep='\t', skiprows=4)
# delete the SC column to save memory
del df['SC']
# convert YYYYetc column to a datetime
df['Date'] = pd.to_datetime(df['YYYY-MM-DD HH:MM:SS'])
# delete YYYYetc column
del df['YYYY-MM-DD HH:MM:SS']
for y in range(1992, 2015):
    print(y)
    filnam = 'V2_phas_noch31/v2_{}_noch31.txt'.format(y)
    df2 = pd.read_csv(filnam, sep='\t', skiprows=4)
    del df2['SC']
    df2['Date'] = pd.to_datetime(df2['YYYY-MM-DD HH:MM:SS'])
    del df2['YYYY-MM-DD HH:MM:SS']
    df = pd.concat([df, df2], ignore_index=True)
df.to_pickle('V2_phas.pd')
#df.info()
del df
del df2
%matplotlib inline
import pandas as pd
import matplotlib as mpl
import matplotlib.pyplot as plt
import numpy as np
import os
import sys
import time
import operator
import multiprocessing
from multiprocessing import Pool
mpl.rcParams['axes.titlesize'] = 28
mpl.rcParams['font.size'] = 28
mpl.rcParams['legend.fontsize'] = 18
mpl.rcParams['patch.edgecolor'] = 'none'
boxlimitstr = """
1,0.,11., 1,300,1,300,0,20,0,20,
3,0.,6., 1,300, 1,300, 0,20, 0,20,
4,0.,2.2, 1,300, 1,300, 0,20, 0,20,
5,0.,2.2, 1,300, 1,300, 0,20, 0,20,
6,0.,2.2, 1,300, 1,300, 0,20, 0,20,
7,0.,2., 1,300, 1,300, 0,20, 0,20,
8,0.,2., 1,300, 1,300, 0,20, 0,20,
9,0.,2., 1,300, 1,300, 0,20, 0,20,
16,0.,10., 5,300, 0,60, 0,20, 10,300,
17,0.,1.e2, 5,300, 0,60, 0,20, 10,300,
18,0.,1.e-0, 5,300, 0,60, 0,20, 10,300,
19,0.,1.e-0, 5,300, 0,60, 0,20, 10,300,
20,0.,1.e-0, 5,300, 0,60, 0,20, 10,300,
21,0.,2.2, 1,300, 1,300, 0,20, 0,20,
23,0.,1.e3, 1,300, 0,60, 5,300, 5,300,
24,0.,1.e2, 1,300, 0,60, 5,300, 5,300,
25,0.,1.e2, 1,300, 0,60, 5,300, 5,300,
31,0.,1.e4, 1,300, 1,300, 1,300, 1,300,
43,0.,2.2, 1,300, 1,300, 0,20, 0,20,
"""
boxlimits = {}
for line in boxlimitstr.split('\n')[1:-1]:
rate, _, _, *limits = [int(float(x)) for x in line.split(',')[:-1]]
boxlimits[rate] = limits
ratedict = {0o40 : 'R01', 0o140 : 'R01', 0o41 : 'R02', 0o141 : 'R02',
0o42 : 'R03', 0o142 : 'R03', 0o43 : 'R04', 0o143 : 'R04',
0o20 : 'R05', 0o120 : 'R05', 0o21 : 'R06', 0o121 : 'R06',
0o22 : 'R07', 0o122 : 'R07', 0o60 : 'R08', 0o160 : 'R08',
0o61 : 'R09', 0o161 : 'R09', 0o44 : 'R10', 0o144 : 'R10',
0o244 : 'R10', 0o344 : 'R10', 0o45 : 'R11', 0o145 : 'R11',
0o245 : 'R11', 0o345 : 'R11', 0o46 : 'R12', 0o146 : 'R12',
0o246 : 'R12', 0o346 : 'R12', 0o47 : 'R13', 0o147 : 'R13',
0o247 : 'R13', 0o347 : 'R13', 0o23 : 'R14', 0o123 : 'R14',
0o223 : 'R14', 0o323 : 'R14', 0o24 : 'R15', 0o124 : 'R15',
0o224 : 'R15', 0o324 : 'R15', 0o62 : 'R43', 0o162 : 'R43',
0o262 : 'R43', 0o362 : 'R43', 0o340 : 'R16', 0o341 : 'R17',
0o320 : 'R18', 0o321 : 'R19', 0o322 : 'R20', 0o360 : 'R21',
0o361 : 'R22', 0o342 : 'R23', 0o343 : 'R24', 0o325 : 'R25',
0o364 : 'R26', 0o351 : 'R27', 0o350 : 'R28', 0o326 : 'R29',
0o370 : 'R30', 0o52 : 'R31', 0o152 : 'R31', 0o252 : 'R31',
0o352 : 'R31', 0o241 : 'R32', 0o240 : 'R33', 0o220 : 'R34',
0o221 : 'R35', 0o260 : 'R36'}
def floatstr(s):
try:
return float(s)
except ValueError:
return s
def parseivfstring(ivfs):
"""Split a ine from an ivf file into components and compute slopes for
the upper and lower Y detector limits. Return the rate box limits for
this rate, the detector pair, x detector limits, y detector slopes and
intercepts, and the 4 pairs of detector limits for each rate id"""
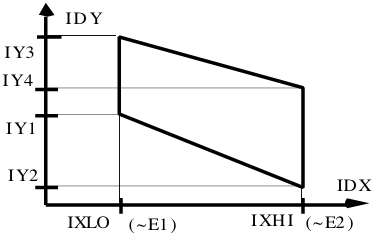
#IBXNAM IBNUM, IDY, IDX, IXLO, IXHI, IY(1,i), IY(2,i), IY(3,i), IY(4,i), E1, E2, G, IADDON, INORM,
# O 800, 1,2, 49, 97, 107,107, 110,110, 0.60, 0.95, .441, 0,0,
elem_rate, dety, detx, xlo, xhi, y1, y2, y3, y4, e1, e2, *junk = \
[floatstr(x) for x in ivfs.split(',')]
elem, box = [x.strip() for x in elem_rate.split()]
box = int(box)
if box >= 100:
box = box // 100
d1lo, d1hi, d2lo, d2hi, d3lo, d3hi, d4lo, d4hi = \
boxlimits.get(box, [0,300,0,300,0,300,0,300])
boxstr = '{:<2s}{:4d}{:3.0f}{:3.0f}{:4.0f}{:4.0f}{:4.0f}{:4.0f}{:4.0f}{:4.0f}{:6.2f}{:6.2f}'.format(\
elem, box, dety, detx, xlo, xhi, y1, y2, y3, y4, e1, e2)
if dety in [1,5]:
dy = 'D1D5'
else:
dy = 'D{}'.format(int(dety))
if detx in [1,5]:
dx = 'D1D5'
else:
dx = 'D{}'.format(int(detx))
mlo = (y1 - y2) / (xlo - xhi)
mhi = (y3 - y4) / (xlo - xhi)
return boxstr, dx, dy, xlo, xhi, mlo, mhi, y1, y3, \
d1lo, d1hi, d2lo, d2hi, d3lo, d3hi, d4lo, d4hi
def phaidhist(df, ivfs, dates, outfile=None, withboxlimits=True):
"""Select the PHAs within the fluxbox limits of the ivf string
if withboxlimits is True, remove PHAs outside of the 4 detector limits
Count the number of PHAs for each rate id and write to text and excel files"""
print(ivfs)
octfmt = lambda s: '{:6o}({})'.format(\
int(s[1:-1].split(',')[1]),
ratedict.get(int(s[1:-1].split(',')[1]), 'R??'))
sortkey = lambda s: "{}_{:03o}".format(
ratedict.get(int(s[1:-1].split(',')[1]), 'R9999')[1:],
int(s[1:-1].split(',')[1]))
boxstr, dx, dy, xlo, xhi, mlo, mhi, y1, y3, \
d1lo, d1hi, d2lo, d2hi, d3lo, d3hi, d4lo, d4hi = parseivfstring(ivfs)
counts = pd.DataFrame()
for (start, stop) in dates:
fluxbox = df[(df[dx] >= xlo) & (df[dx] <= xhi) &
(df[dy] >= mlo * (df[dx] - xlo) + y1) &
(df[dy] <= mhi * (df[dx] - xlo) + y3) &
(df['Date'] >= start) & (df['Date'] < stop)].copy()
# fluxbox.to_pickle('fb.pd')
# print(d1lo, d1hi, d2lo, d2hi, d3lo, d3hi, d4lo, d4hi)
if withboxlimits:
didit = []
for phaid in fluxbox['PHAID'].unique():
if not phaid in ratedict.keys():
# print("No ratedict entry for rate {} {:o}".format(phaid, phaid))
continue
rateid = int(ratedict[phaid][1:])
if not rateid in boxlimits.keys() or rateid in didit:
# print("No boxlimits for rate {} {:o}".format(rateid, rateid))
continue
didit.append(rateid)
# get the pha limits for this rateid
d1lo, d1hi, d2lo, d2hi, d3lo, d3hi, d4lo, d4hi = boxlimits[rateid]
# remove any values for this phaid outside of its pha limits
fluxbox.drop(fluxbox.loc[(fluxbox['PHAID'] == phaid) & (
(fluxbox['D1D5'] < d1lo) | (fluxbox['D1D5'] > d1hi) |
(fluxbox['D2'] < d2lo) | (fluxbox['D2'] > d2hi) |
(fluxbox['D3'] < d3lo) | (fluxbox['D3'] > d3hi) |
(fluxbox['D4'] < d4lo) | (fluxbox['D4'] > d4hi))].index,
inplace=True)
# print(fluxbox.count())
if fluxbox.shape[0] > 1:
# need more than 1 row to use groupby
try:
colname = '{:%m/%d/%y} - {:%m/%d/%y}'.format(start, stop)
except ValueError:
colname = '{} - {}'.format(start, stop)
# fluxbox = fluxbox.rename(columns={'PHAID':colname})
# fluxbox.plot(x=d1, y=d2, kind='hexbin', gridsize=20, title=colname, cmap=mpl.cm.gnuplot)
ID_counts = fluxbox.PHAID.groupby(pd.cut(fluxbox.PHAID, range(256))).count()
ID_counts.name=colname
# remove 0 count entries
ID_counts = ID_counts.iloc[ID_counts.nonzero()]
counts = pd.concat([counts, ID_counts, ID_counts/ID_counts.sum()*100], axis=1)
counts = counts.sort_index()
counts.columns = list(counts.columns[:-1]) + ['Frac%',]
print(' rate D1 D2 xlo xhi y1 y2 y3 y4 e1 e2', file=outfile)
print(boxstr, file=outfile)
if counts.empty:
print('No PHAs', file=outfile)
else:
counts['Sortcol'] = [sortkey(v) for v in counts.index.values]
counts.sort('Sortcol', inplace=True)
del counts['Sortcol']
counts.index = [octfmt(c) for c in counts.index]
print(' ', ' '.join(counts.columns[::2]), file=outfile)
print(''.join(['PHAID_octal ', ('{:>24s}'.format(\
'Counts Frac% '))*(len(counts.columns)//2)]), file=outfile)
print(counts.to_string(header=None, col_space=11, na_rep='0',
formatters={'Frac%':lambda s:'{:11.1f}'.format(0 if pd.np.isnan(s) else s)}), file=outfile)
s = counts.sum().values
print(''.join([' Total',
(('{:12.0f} '*(len(s)//2)).format(*s[::2]))]),
file=outfile)
print(file=outfile)
return counts, boxstr
def processivf(ivf, start, outfile=None, withboxlimits=True):
# create an excel file with the same base name as the text file
# and set up an excel writer for it
dirname = os.path.dirname(outfile)
if not os.access(dirname, os.F_OK):
os.mkdir(dirname)
xlfile = os.path.splitext(outfile)[0]
cwriter = pd.ExcelWriter('.'.join([xlfile, 'xlsx']))
twriter = pd.ExcelWriter('_trend.'.join([xlfile, 'xlsx']))
fwriter = pd.ExcelWriter('_trend_frac.'.join([xlfile, 'xlsx']))
with open(outfile, 'w') as outf:
for ivfstr in ivf.split('\n')[1:-1]:
# loop through each fluxbox and select the PHAs that are in
# the box and write to cvs and excel files
counts, boxname = phaidhist(phasdf, ivfstr,
dates=zip(start, start.shift(1)),
outfile=outf, withboxlimits=withboxlimits)
if counts.empty:
continue
# rename the Frac% columns with the start date of the interval
cols = counts.columns.values
cols[1::2] = ['_'.join([x.split(' ')[0], 'Frac%']) for x in cols[::2]]
counts.columns = cols
counts.to_excel(cwriter, sheet_name=boxname.replace(' ', ' ')[:31], float_format='%.2f')
cols[1::2] = [x.split(' ')[0] for x in cols[::2]]
counts.columns = cols
# transpose counts to get a trend and save the counts and fractions to csv and excel files
countsT = counts.T
countsT.columns = [x.strip() for x in countsT.columns]
countsT.index = [x.split(' ')[0] for x in countsT.index]
countsT.index.name = 'Date'
fname = os.path.join(dirname, ''.join([boxname, '_trend.txt']))
countsT.iloc[range(0, countsT.shape[0], 2)].to_csv(fname, sep='\t', na_rep='0')
fname = os.path.join(dirname, ''.join([boxname, '_trend_frac.txt']))
countsT.iloc[range(1, countsT.shape[0], 2)].to_csv(fname, sep='\t', na_rep='0')
countsT.index.name=None
countsT.iloc[range(0, countsT.shape[0], 2)].to_excel(twriter, sheet_name=boxname.replace(' ', ' ')[:31], float_format='%.2f')
countsT.iloc[range(1, countsT.shape[0], 2)].to_excel(fwriter, sheet_name=boxname.replace(' ', ' ')[:31], float_format='%.2f')
cwriter.save()
twriter.save()
fwriter.save()
# return counts
def plotrates(df, rates, start, stop, xdet='D2', ydet='D1D5', xlo=10, xhi=170, ylo=0, yhi=130, zmax=0):
inarray = operator.contains
plt.close('all')
fig=plt.figure(figsize=[15.75,9], dpi=72)
ax = fig.add_subplot(111)
ax.set_xlim([xlo,xhi])
ax.set_ylim([ylo,yhi])
rate, *ids = rates[0]
b1l, b1h, b2l, b2h, b3l, b3h, b4l, b4h = boxlimits.get(rate, ([0,300]*4))
fluxbox = df[#(df['Date'] >= start) & (df['Date'] < stop) &
(df['D1D5'] >= b1l) & (df['D1D5'] <= b1h) &
(df['D2'] >= b2l) & (df['D2'] <= b2h) &
(df['D3'] >= b3l) & (df['D3'] <= b3h) &
(df['D4'] >= b4l) & (df['D4'] <= b4h)]
fluxbox = fluxbox[fluxbox['PHAID'].map(lambda x: x in ids)]
for rate, *ids in rates[1:]:
b1l, b1h, b2l, b2h, b3l, b3h, b4l, b4h = boxlimits.get(rate, ([0,300]*4))
df2 = df[#(df['Date'] >= start) & (df['Date'] < stop) &
(df['D1D5'] >= b1l) & (df['D1D5'] <= b1h) &
(df['D2'] >= b2l) & (df['D2'] <= b2h) &
(df['D3'] >= b3l) & (df['D3'] <= b3h) &
(df['D4'] >= b4l) & (df['D4'] <= b4h)]
df2 = df2[inarray(ids, df2['PHAID'])]
fluxbox = pd.concat([fluxbox, df2])
if len(rates) > 1:
ratestr = ','.join([str(r[0]) for r in rates])
title = "Rate Ch {}, {} - {}, {}pts".format(ratestr, start, stop, str(fluxbox[xdet].count()))
filename = 'RateCh{}{}{}_{}-{}'.format(ratestr, xdet, ydet,
'-'.join(start.split('/')), '-'.join(stop.split('/')))
else:
title = "Rate Ch {}, {} - {}, {}pts\n{}, {}".format(','.join([str(r[0]) for r in rates]),
start, stop, str(fluxbox['D1D5'].count()),
'|'.join(['{:03o}'.format(x) for x in ids]),
','.join([str(x) for x in (b1l, b1h, b2l, b2h, b3l, b3h, b4l, b4h)]))
filename = 'RateCh{}({}){}{}_{}-{}'.format(\
rate, '|'.join(['{:03o}'.format(x) for x in ids]),xdet, ydet,
'-'.join(start.split('/')), '-'.join(stop.split('/')))
hb = True
if hb:
if zmax > 0:
ax = fluxbox.plot(ax=ax, kind='hexbin', x=xdet, y=ydet,
title=title, zorder=10,
gridsize=((xhi-xlo)//2., (yhi-ylo)//2.),
reduce_C_function = np.sum,
bins='log', cmap=plt.cm.rainbow,
vmax=zmax, extent=(xlo, xhi, ylo, yhi))
else:
ax = fluxbox.plot(ax=ax, kind='hexbin', x=xdet, y=ydet,
title=title, zorder=10,
# gridsize=(xhi-xlo, yhi-ylo),
reduce_C_function = np.sum,
bins='log', cmap=plt.cm.rainbow,
extent=(xlo, xhi, ylo, yhi))
else:
fluxbox = fluxbox.drop_duplicates()
ax = fluxbox.plot(ax=ax, kind='scatter', x=xdet, y=ydet,
s=36, c='b', #label='{:03o}'.format(id2),
marker='x', title=title, zorder=10)
# Draw the D15D2 box boundaries for C, N, O, Ne, H and He
if xdet == 'D2':
for xlo, xhi, y1, y2, y3, y4, color in [[ 49, 97, 107,107, 110,110, (0,1,0,0.5)], # O
[ 98,114, 107,106, 110,110, (0,1,1,0.5)], # O
[115,126, 106,104, 110,109, (1,1,0,0.5)], # O
[127,135, 104,100, 109,105, (0,0,1,0.5)], # O
[136,143, 100, 96, 105,101, (1,0,1,0.5)], # O
[144,157, 96, 90, 100, 95, (1,0,0,0.5)], # O
[ 50, 97, 105,105, 106,106, (0,1,0,0.5)], # N
[ 98,113, 105,104, 106,105, (0,1,1,0.5)], # N
[114,124, 104,101, 106,104, (1,1,0,0.5)], # N
[125,133, 101, 97, 104,101, (0,0,1,0.5)], # N
[134,141, 96, 92, 100, 97, (1,0,1,0.5)], # N
[142,153, 92, 86, 96, 91, (1,0,0,0.5)], # N
[ 57, 97, 100,100, 104,104, (0,1,0,0.5)], # C
[ 98,111, 100, 99, 104,103, (0,1,1,0.5)], # C
[112,122, 99, 95, 103,101, (1,1,0,0.5)], # C
[123,130, 95, 91, 101, 97, (0,0,1,0.5)], # C
[131,138, 91, 87, 96, 92, (1,0,1,0.5)], # C
[ 42, 58, 51, 46, 63, 60, (0,1,0,0.5)], # H
[ 59, 66, 46, 42, 60, 58, (0,1,1,0.5)], # H
[ 67, 71, 41, 40, 58, 57, (1,1,0,0.5)], # H
[ 70, 82, 75, 72, 81, 79, (0,1,0,0.5)], # He
[ 83, 89, 72, 69, 79, 76, (0,1,1,0.5)], # He
[ 90, 94, 69, 67, 76, 74, (1,1,0,0.5)], # He
[ 95,105, 67, 60, 74, 67, (0,0,1,0.5)], # He
[108,114, 58, 54, 67, 63, (1,0,1,0.5)], # He
[117,129, 112,110, 114,113, (0,1,0,0.5)], # Ne
[130,138, 109,107, 113,111, (0,1,1,0.5)], # Ne
[139,149, 106,102, 110,107, (1,1,0,0.5)], # Ne
[149,163, 102, 98, 106,103, (0,0,1,0.5)] # Ne
]:
ply = mpl.patches.Polygon(pd.np.array([(xlo, y1), (xlo, y3+1.), (xhi+1., y4+1.),
(xhi+1., y2), (xlo, y1)]),
closed=True, axes=ax, zorder=100, lw=2,
ec=(1,1,1), fc=(0,0,0,0))#, ec=color, fc=color
ax.add_patch(ply)
elif xdet == 'D4':
for xlo, xhi, y1, y2, y3, y4, color in [[ 54, 65, 57, 51, 69, 65, (0,1,1,0.5)], # H
[ 66, 71, 51, 51, 65, 62, (1,1,0,0.5)], # H
[ 60, 75, 90, 86, 94, 92, (0,1,1,0.5)], # He
[ 76, 87, 86, 80, 92, 86, (1,1,0,0.5)], # He
[ 90, 98, 78, 73, 84, 79, (0,0,1,0.5)], # He
[ 99,105, 72, 67, 78, 74, (1,0,1,0.5)], # He
[100,113, 116,109, 120,115, (0,1,1,0.5)], # C
[114,122, 108,103, 114,109, (1,1,0,0.5)], # C
[123,129, 103, 99, 109,104, (0,0,1,0.5)], # C
[130,135, 99, 95, 103,100, (1,0,1,0.5)], # C
[ 98,115, 122,116, 124,119, (0,1,1,0.5)], # N
[116,124, 115,109, 118,114, (1,1,0,0.5)], # N
[125,132, 109,104, 113,107, (0,0,1,0.5)], # N
[133,138, 104,100, 107,103, (1,0,1,0.5)], # N
[ 95,116, 126,120, 130,125, (0,1,1,0.5)], # O
[117,126, 119,114, 124,119, (1,1,0,0.5)], # O
[127,134, 113,108, 118,113, (0,0,1,0.5)], # O
[135,140, 108,104, 112,108, (1,0,1,0.5)], # O
[ 98,118, 133,127, 135,132, (0,1,1,0.5)], # Ne
[119,129, 127,121, 130,125, (1,1,0,0.5)], # Ne
[130,137, 121,116, 125,120, (0,0,1,0.5)] # Ne
]:
ply = mpl.patches.Polygon(pd.np.array([(xlo, y1), (xlo, y3+1.), (xhi+1., y4+1.),
(xhi+1., y2), (xlo, y1)]), lw=2,
closed=True, axes=ax, zorder=100, ec=(1,1,1), fc=(0,0,0,0))#, ec=color, fc=color
ax.add_patch(ply)
elif xdet == 'D3':
for xlo, xhi, y1, y2, y3, y4, color in [[ 50, 75, 78, 74, 84, 82, (0,1,1,0.5)], # H
[ 76, 83, 72, 72, 82, 78, (1,1,0,0.5)], # H
[ 14, 48, 15, 15, 49, 49, (0,1,1,0.5)], # H
[ 61,107, 102, 94, 110,102, (0,1,1,0.5)], # He
[110,136, 128,120, 134,126, (0,1,1,0.5)], # C
[114,144, 138,129, 142,134, (0,1,1,0.5)], # O
]:
ply = mpl.patches.Polygon(pd.np.array([(xlo, y1), (xlo, y3+1.), (xhi+1., y4+1.),
(xhi+1., y2), (xlo, y1)]), lw=2,
closed=True, axes=ax, zorder=100, ec=(1,1,1), fc=(0,0,0,0))#, ec=color, fc=color
ax.add_patch(ply)
fig.savefig('{}.pdf'.format(filename))
fig.savefig('{}.png'.format(filename), dpi=150)
"""Read the Voyager2 phas dataframe from disk for writing the excel files.
Remove PHAs from sector 8 since it contains the alpha source
Remove PHAs with rate ids 27-30 since they are just background and 'pollute'
many fluxboxes 0o351 : 'R27', 0o350 : 'R28', 0o326 : 'R29', 0o370 : 'R30'
Set up the yearly start times from 4/1/1991 to 4/1/2014"""

phasdf = pd.read_pickle('v2_phas.pd')
# get rid of sector 8 and rate id 29
phasdf = phasdf[(phasdf['Sector'] != 8) &
                (phasdf['PHAID_octal'] != 'o351') &
                (phasdf['PHAID_octal'] != 'o350') &
                (phasdf['PHAID_octal'] != 'o326') &
                (phasdf['PHAID_octal'] != 'o370')
               ]

# start is a date range from 4/1/91 to 4/1/14 each start of the month
start = pd.date_range(start='4/1/1991', end='4/1/2014', freq='12MS')
# get O PHAs boxes from v2_new.ivf
ivfO = """
O  800, 1,2,  49, 97, 107,107, 110,110,  0.60, 0.95, .441, 0,0,
O  600, 1,2,  98,114, 107,106, 110,110,  0.95, 1.40, .441, 1,0,
O  600, 1,2, 115,126, 106,104, 110,109,  1.40, 2.13, .441, 0,0,
O  600, 1,2, 127,135, 104,100, 109,105,  2.13, 3.17, .441, 0,0,
O  600, 1,2, 136,143, 100, 96, 105,101,  3.17, 4.78, .441, 0,0,
O  600, 1,2, 144,157,  96, 90, 100, 95,  4.78, 7.34, .441, 0,0,
O   19, 5,4,  95,116, 126,120, 130,125,   8.0, 12.1, 1.50, 0,0,
O   20, 5,4, 117,126, 119,114, 124,119,  12.1, 18.2, 1.50, 0,0,
O   20, 5,4, 127,134, 113,108, 118,113,  18.2, 27.4, 1.50, 0,0,
O   20, 5,4, 135,140, 108,104, 112,108,  27.4, 38.3, 1.50, 0,0,
O   25, 4,3, 114,144, 138,129, 142,134,  46.2, 63.5, 1.31, 0,0,
"""

O = multiprocessing.Process(target=processivf, args=(ivfO, start, 'O_yearly/v2_o_yearly.txt'))
O.start()
#processivf(ivfO, start, 'v2_o_yearly.txt')
# get C PHAs boxes from v2_new.ivf
ivfC = """
C  600, 1,2,  57, 97, 100,100, 104,104,  0.60, 0.95, .441, 0,0,
C  600, 1,2,  98,111, 100, 99, 104,103,  0.95, 1.38, .441, 0,0,
C  600, 1,2, 112,122,  99, 95, 103,101,  1.38, 2.10, .441, 0,0,
C  600, 1,2, 123,130,  95, 91, 101, 97,  2.10, 3.05, .441, 0,0,
C  500, 1,2, 131,138,  91, 87,  96, 92,  3.05, 4.63, .441, 0,0,
C   18, 5,4, 100,113, 116,109, 120,115,   8.1, 12.1, 1.50, 0,0,
C   20, 5,4, 114,122, 108,103, 114,109,  12.1, 18.2, 1.50, 0,0,
C   20, 5,4, 123,129, 103, 99, 109,104,  18.2, 26.6, 1.50, 0,0,
C   20, 5,4, 130,135,  99, 95, 103,100,  26.6, 37.4, 1.50, 0,0,
C   25, 4,3, 110,136, 128,120, 134,126,  39.6, 53.8, 1.31, 0,0,
"""

#processivf(ivf, start, 'v2_c_yearly.txt')
C = multiprocessing.Process(target=processivf, args=(ivfC, start, 'C_yearly/v2_c_yearly.txt'))
C.start()
# get N PHAs boxes from v2_new.ivf
ivfN = """
N  600, 1,2,  50, 97, 105,105, 106,106,  0.60, 0.95, .441, 0,0,
N  600, 1,2,  98,113, 105,104, 106,105,  0.95, 1.41, .441, 0,0,
N  600, 1,2, 114,124, 104,101, 106,104,  1.41, 2.10, .441, 0,0,
N  600, 1,2, 125,133, 101, 97, 104,101,  2.10, 3.16, .441, 0,0,
N  600, 1,2, 134,141,  96, 92, 100, 97,  3.16, 4.79, .441, 0,0,
N  600, 1,2, 142,153,  92, 86,  96, 91,  4.79, 7.32, .441, 0,0,
N   19, 5,4,  98,115, 122,116, 124,119,   8.0, 12.3, 1.50, 0,0,
N   20, 5,4, 116,124, 115,109, 118,114,  12.3, 18.1, 1.50, 0,0,
N   20, 5,4, 125,132, 109,104, 113,107,  18.1, 27.5, 1.50, 0,0,
N   20, 5,4, 133,138, 104,100, 107,103,  27.5, 38.6, 1.50, 0,0,
"""

N = multiprocessing.Process(target=processivf, args=(ivfN, start, 'N_yearly/v2_n_yearly.txt'))
N.start()

# old method
#with open('v2_N_3month.txt', 'w') as outf:
#    for ivfstr in ivf.split('\n')[1:-1]:
#        _, _ = phaidhist(phasdf, ivfstr, dates=zip(start, start.shift(1)), outfile=outf)
# get C PHAs boxes from v2_new.ivf
ivfH = """
H  100, 1,2,  42, 58,  51, 46,  63, 60,  0.60, 0.76, .441, 0,0,
H  100, 1,2,  59, 66,  46, 42,  60, 58,  0.76, 0.94, .441, 0,0,
H  100, 1,2,  67, 71,  41, 40,  58, 57,  0.94, 1.13, .441, 0,0,
H   16, 5,4,  54, 65,  57, 51,  69, 65,   4.8,  7.4, 1.50, 0,0,
H   16, 5,4,  66, 71,  51, 51,  65, 62,   7.4,  9.8, 1.50, 0,0,
H   23, 4,3,  50, 75,  78, 74,  84, 82,  21.0, 24.4, 1.31, 0,0,
H   23, 4,3,  76, 83,  72, 72,  82, 78,  24.4, 28.6, 1.31, 0,0,
H   31, 4,3,  14, 48,  15, 15,  49, 49, 213.0,214.0, 1.00, 0,0,
"""

H = multiprocessing.Process(target=processivf, args=(ivfH, start, 'H_yearly/v2_h_yearly.txt'))
H.start()
ivfNe = """
Ne 800, 1,2, 117,129, 112,110, 114,113,  1.39, 2.13, .441, 0,0,
Ne 600, 1,2, 130,138, 109,107, 113,111,  2.13, 3.14, .441, 0,0,
Ne 600, 1,2, 139,149, 106,102, 110,107,  3.14, 4.78, .441, 0,0,
Ne 900, 1,2, 149,163, 102, 98, 106,103,  4.78, 7.24, .441, 0,0,
Ne  19, 5,4,  98,118, 133,127, 135,132,   8.7, 12.2, 1.50, 0,0,
Ne  20, 5,4, 119,129, 127,121, 130,125,  12.2, 18.2, 1.50, 0,0,
Ne  20, 5,4, 130,137, 121,116, 125,120,  18.2, 26.9, 1.50, 0,0,
"""

Ne = multiprocessing.Process(target=processivf, args=(ivfNe, start, 'Ne_yearly/v2_ne_yearly.txt'))
Ne.start()
ivfHe = """
He 300, 1,2,  70, 82,  75, 72,  81, 79,  0.60, 0.77, .441, 0,0,
He 300, 1,2,  83, 89,  72, 69,  79, 76,  0.77, 0.95, .441, 0,0,
He 300, 1,2,  90, 94,  69, 67,  76, 74,  0.95, 1.15, .441, 0,0,
He 300, 1,2,  95,105,  67, 60,  74, 67,  1.15, 1.93, .441, 0,0,
He 400, 1,2, 108,114,  58, 54,  67, 63,  2.14, 3.15, .441, 0,0,
He  17, 5,4,  60, 75,  90, 86,  94, 92,  3.71, 4.75, 1.50, 0,0,
He  17, 5,4,  76, 87,  86, 80,  92, 86,  4.75,  7.2, 1.50, 0,0,
He  17, 5,4,  90, 98,  78, 73,  84, 79,  7.85, 12.3, 1.50, 0,0,
He  17, 5,4,  99,105,  72, 67,  78, 74,  12.3, 18.2, 1.50, 0,0,
He  24, 4,3,  61,107, 102, 94, 110,102,  20.8, 29.0, 1.31, 0,0,
"""

He = multiprocessing.Process(target=processivf, args=(ivfHe, start, 'He_yearly/v2_he_yearly.txt'))
He.start()
"""Read the Voyager2 phas dataframe from disk for plotting.
Set up the start times"""

phasdf = pd.read_pickle('v2_phas.pd')

# start is a date range from 4/1/91 to 4/1/14 each start of the month
start = pd.date_range(start='4/1/1991', end='4/1/2014', freq='12MS')
# Plot D2 vs D1D5 PHAs
poold1d2 = Pool(6)
for (start, stop, zmax) in [('1/1/91','4/1/05', 2.4), ('5/1/05', '1/1/14', 3.0),]:
    df = phasdf[(phasdf['Date'] >= start) & (phasdf['Date'] < stop)]
    for rates in [(7,0o022,0o122), (8,0o060,0o160), (9,0o061,0o161),]:
        poold1d2.apply_async(plotrates, args=(df, [rates,], start, stop, 'D2', 'D1D5',
                                              10, 170, 0, 130, zmax))
poold1d2.close()
# Plot D4 vs D1D5 PHAs
poold1d4 = Pool(6)
for (start, stop, zmax) in [('1/1/91','4/1/05', 2.4), ('5/1/05', '1/1/14', 2.4)]:
    for rates in [(16,0o340), (17,0o341), (18,0o320),
                  (19,0o321), (20,0o322), (21,0o360), (22,0o361)]:
        poold1d4.apply_async(plotrates, args=(phasdf, [rates,], start, stop, 'D4', 'D1D5',
                                              0, 160, 0, 160, zmax))
poold1d4.close()
# Plot D3 vs D2 PHAs
poold2d3 = Pool(6)
for (start, stop, zmax) in [('1/1/91','4/1/05', 2.4), ('5/1/05', '1/1/14', 3.0),]:
    df = phasdf[(phasdf['Date'] >= start) & (phasdf['Date'] < stop)]
    for rates in [(1,0o040,0o140), (2,0o041,0o141), (3,0o042,0o142),
                  (4,0o043,0o143), (5,0o020,0o120), (6,0o021,0o121),
                  (7,0o022,0o122), (8,0o060,0o160), (9,0o061,0o161),
                  (10,0o044,0o144,0o344), (11,0o045,0o145,0o345),
                  (12,0o046,0o146,0o346), (13,0o047,0o147,0o347),
                  (14,0o023,0o123,0o323), (15,0o024,0o124,0o324),
                  (16,0o340), (17,0o341), (18,0o320),
                  (19,0o321), (20,0o322), (21,0o360), (22,0o361),
                  (23,0o342), (24,0o343), (25,0o325), (26,0o364),
                  (27,0o351), (28,0o350), (29,0o326), (30,0o370),
                  (32,0o241), (33,0o240), (34,0o220), (35,0o221),
                  (36,0o260), (43,0o062,0o162,0o362)]:
        poold2d3.apply_async(plotrates, args=(df, [rates,], start, stop, 'D3', 'D2',
                                              0, 180, 0, 180, zmax))
poold2d3.close()