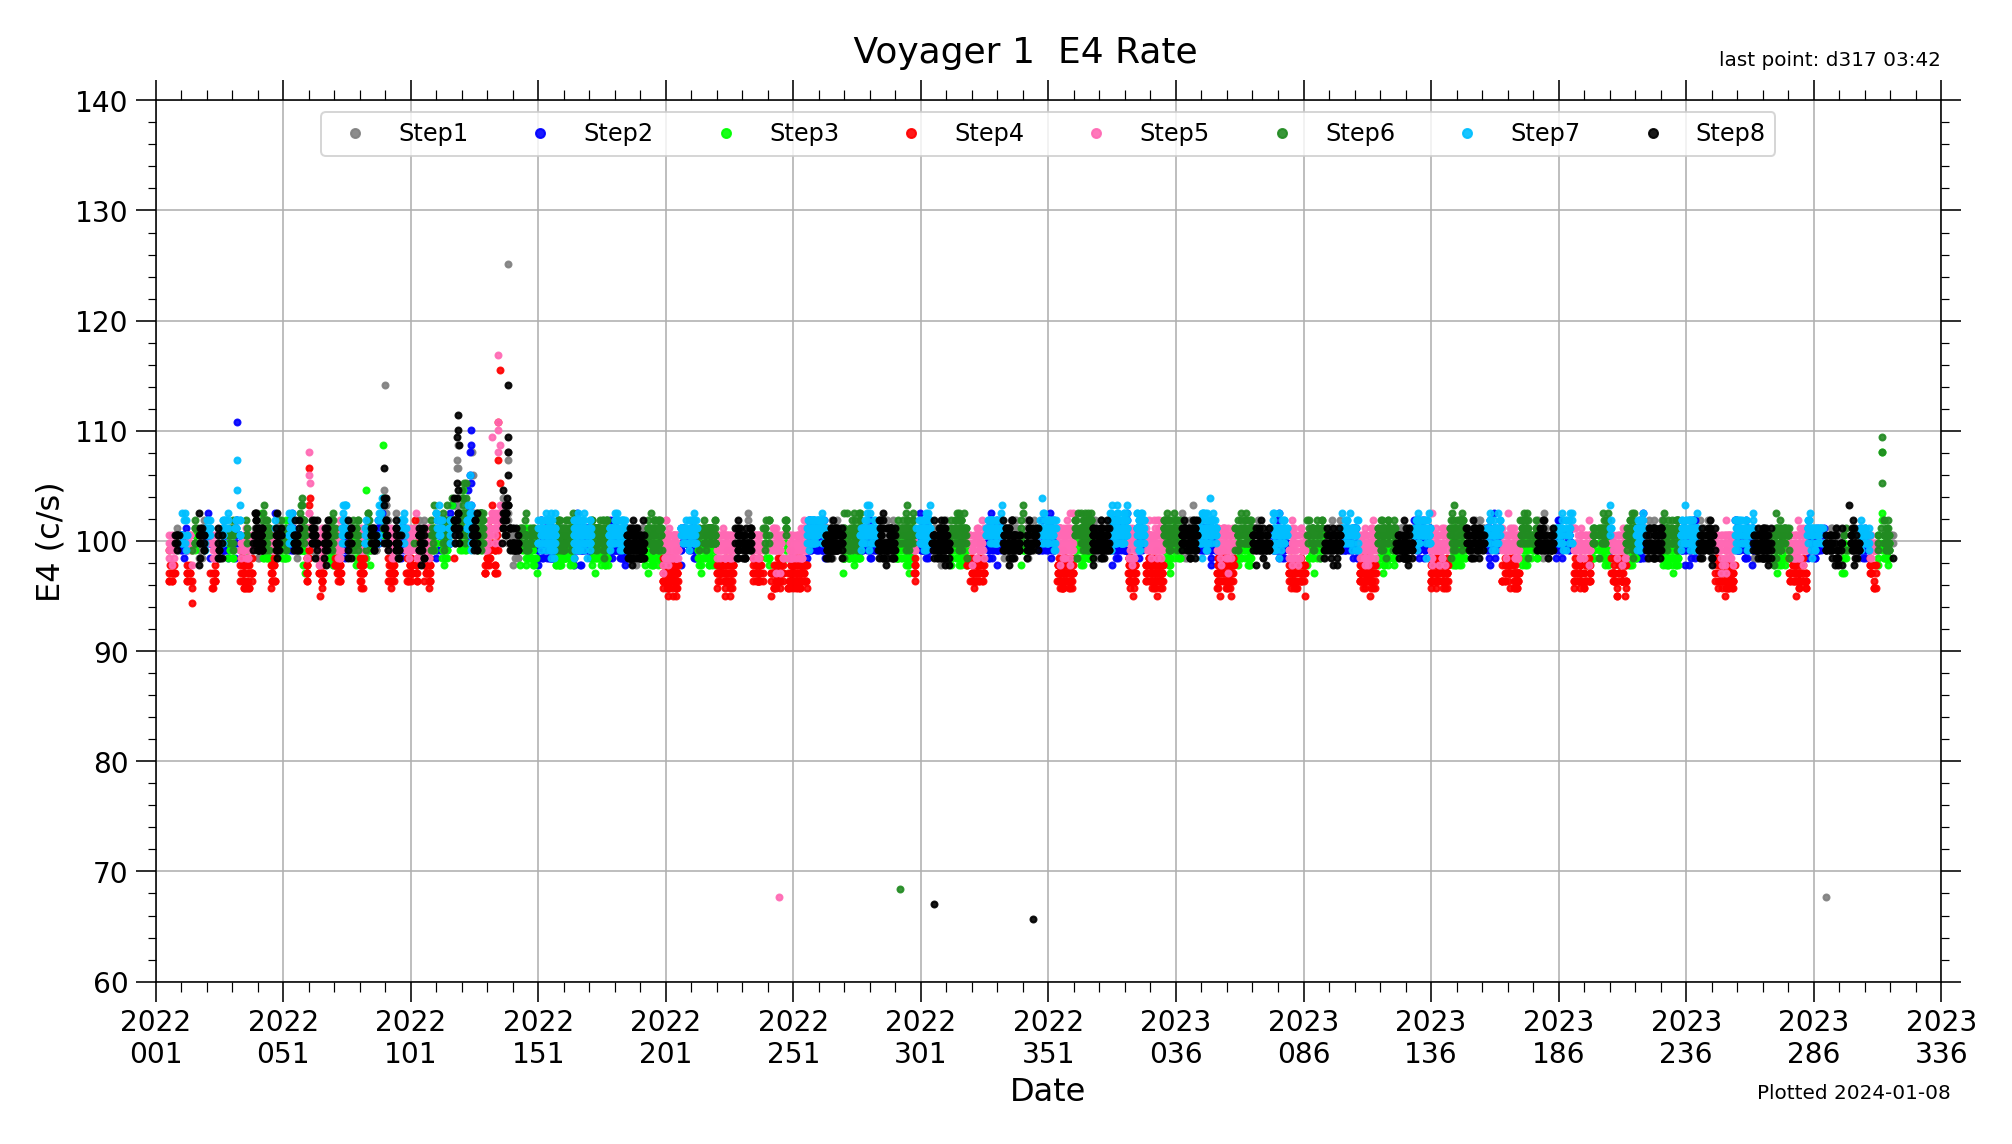
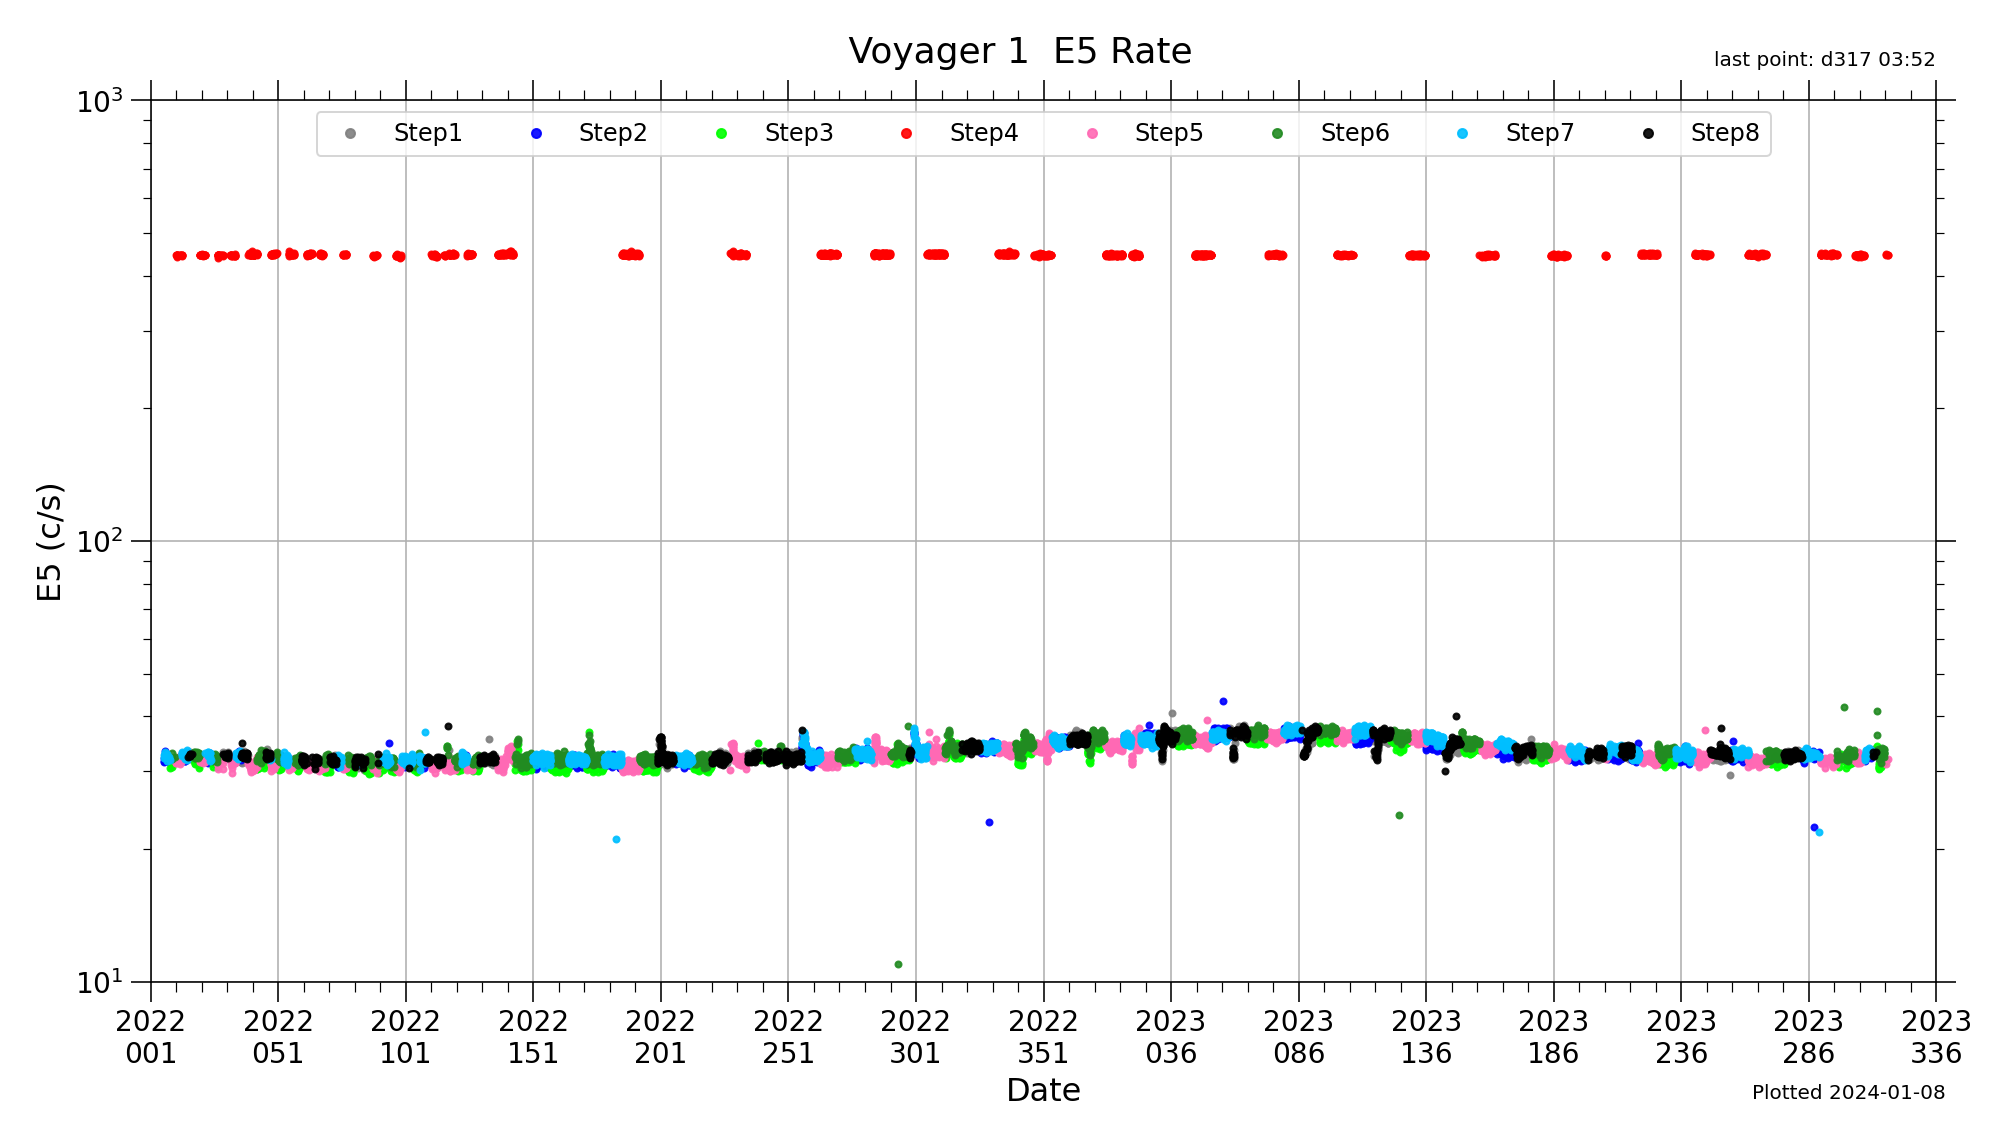
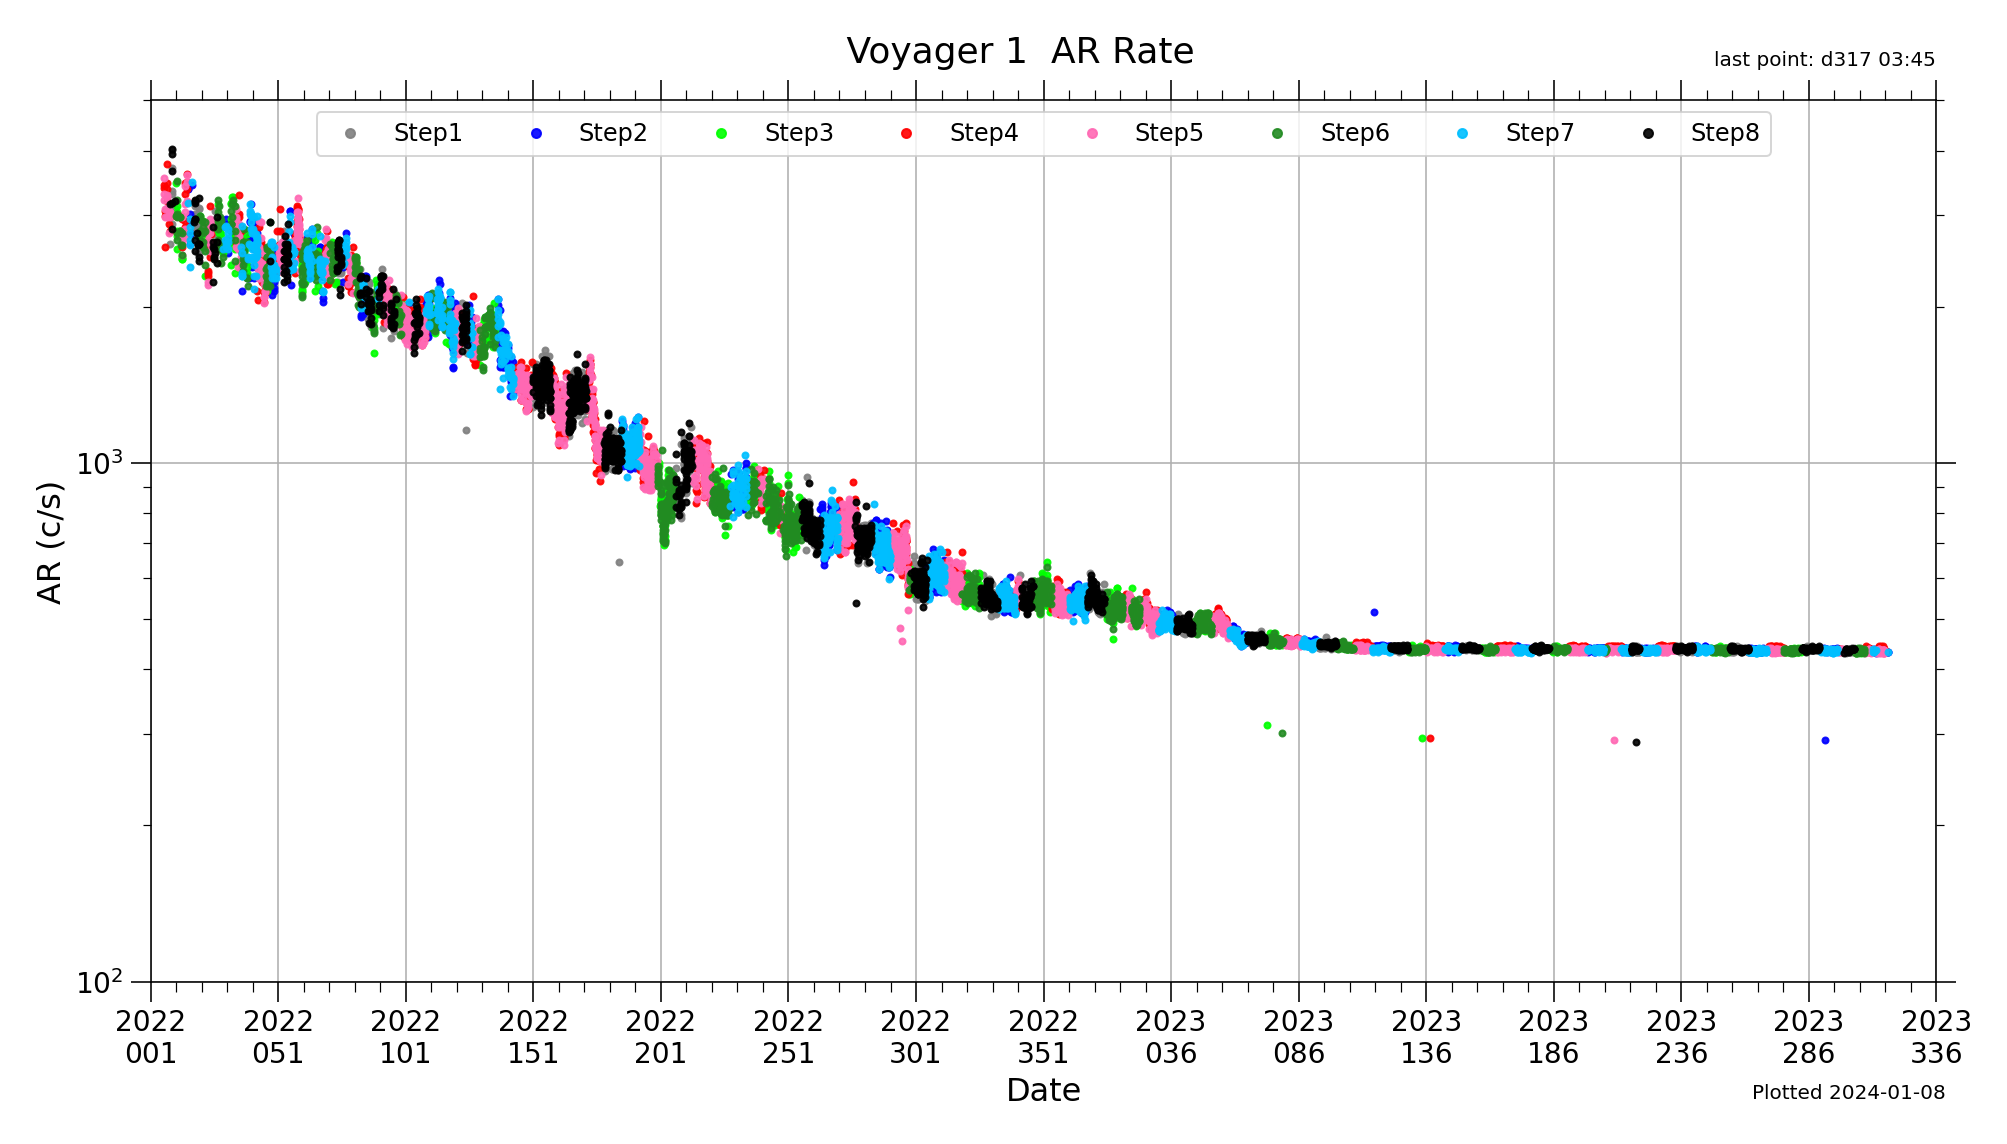
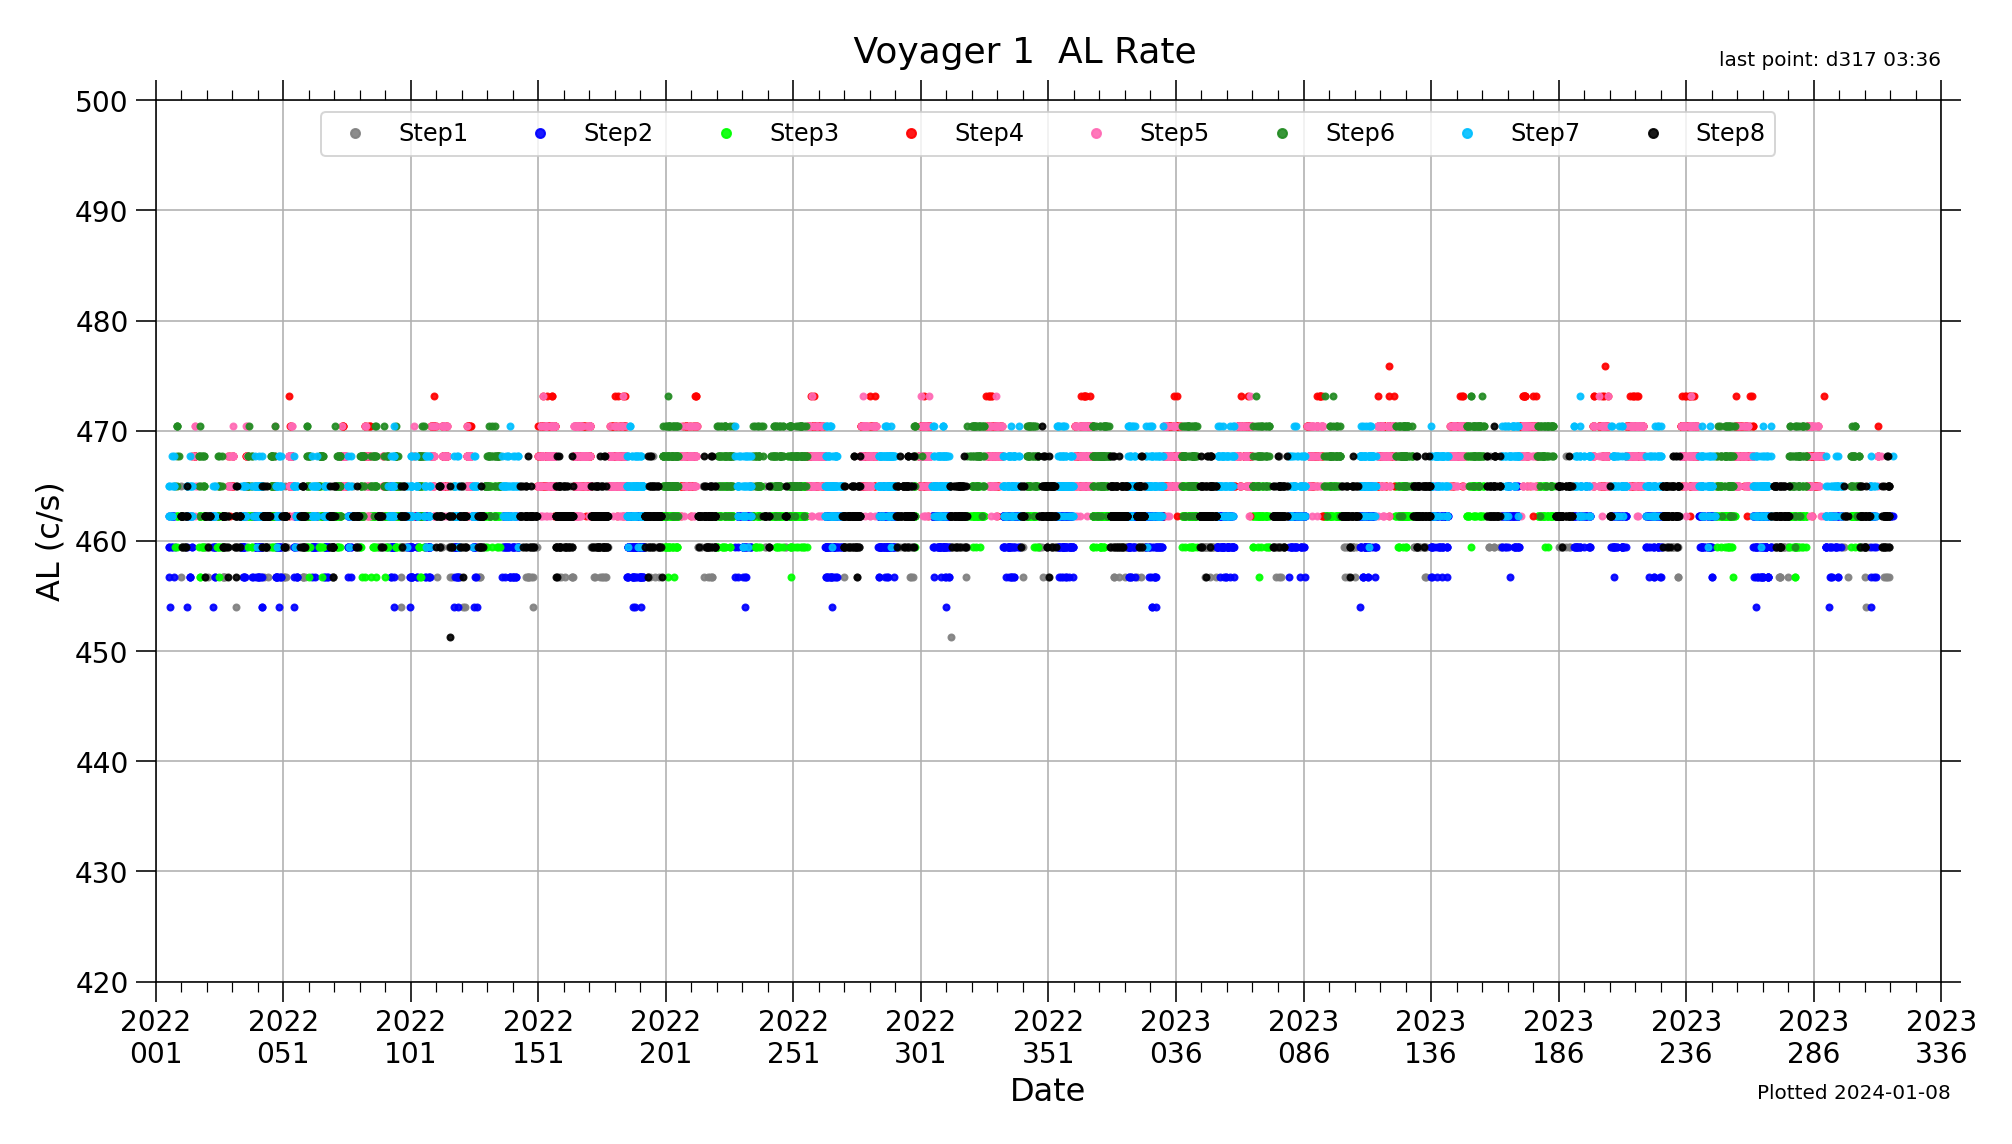
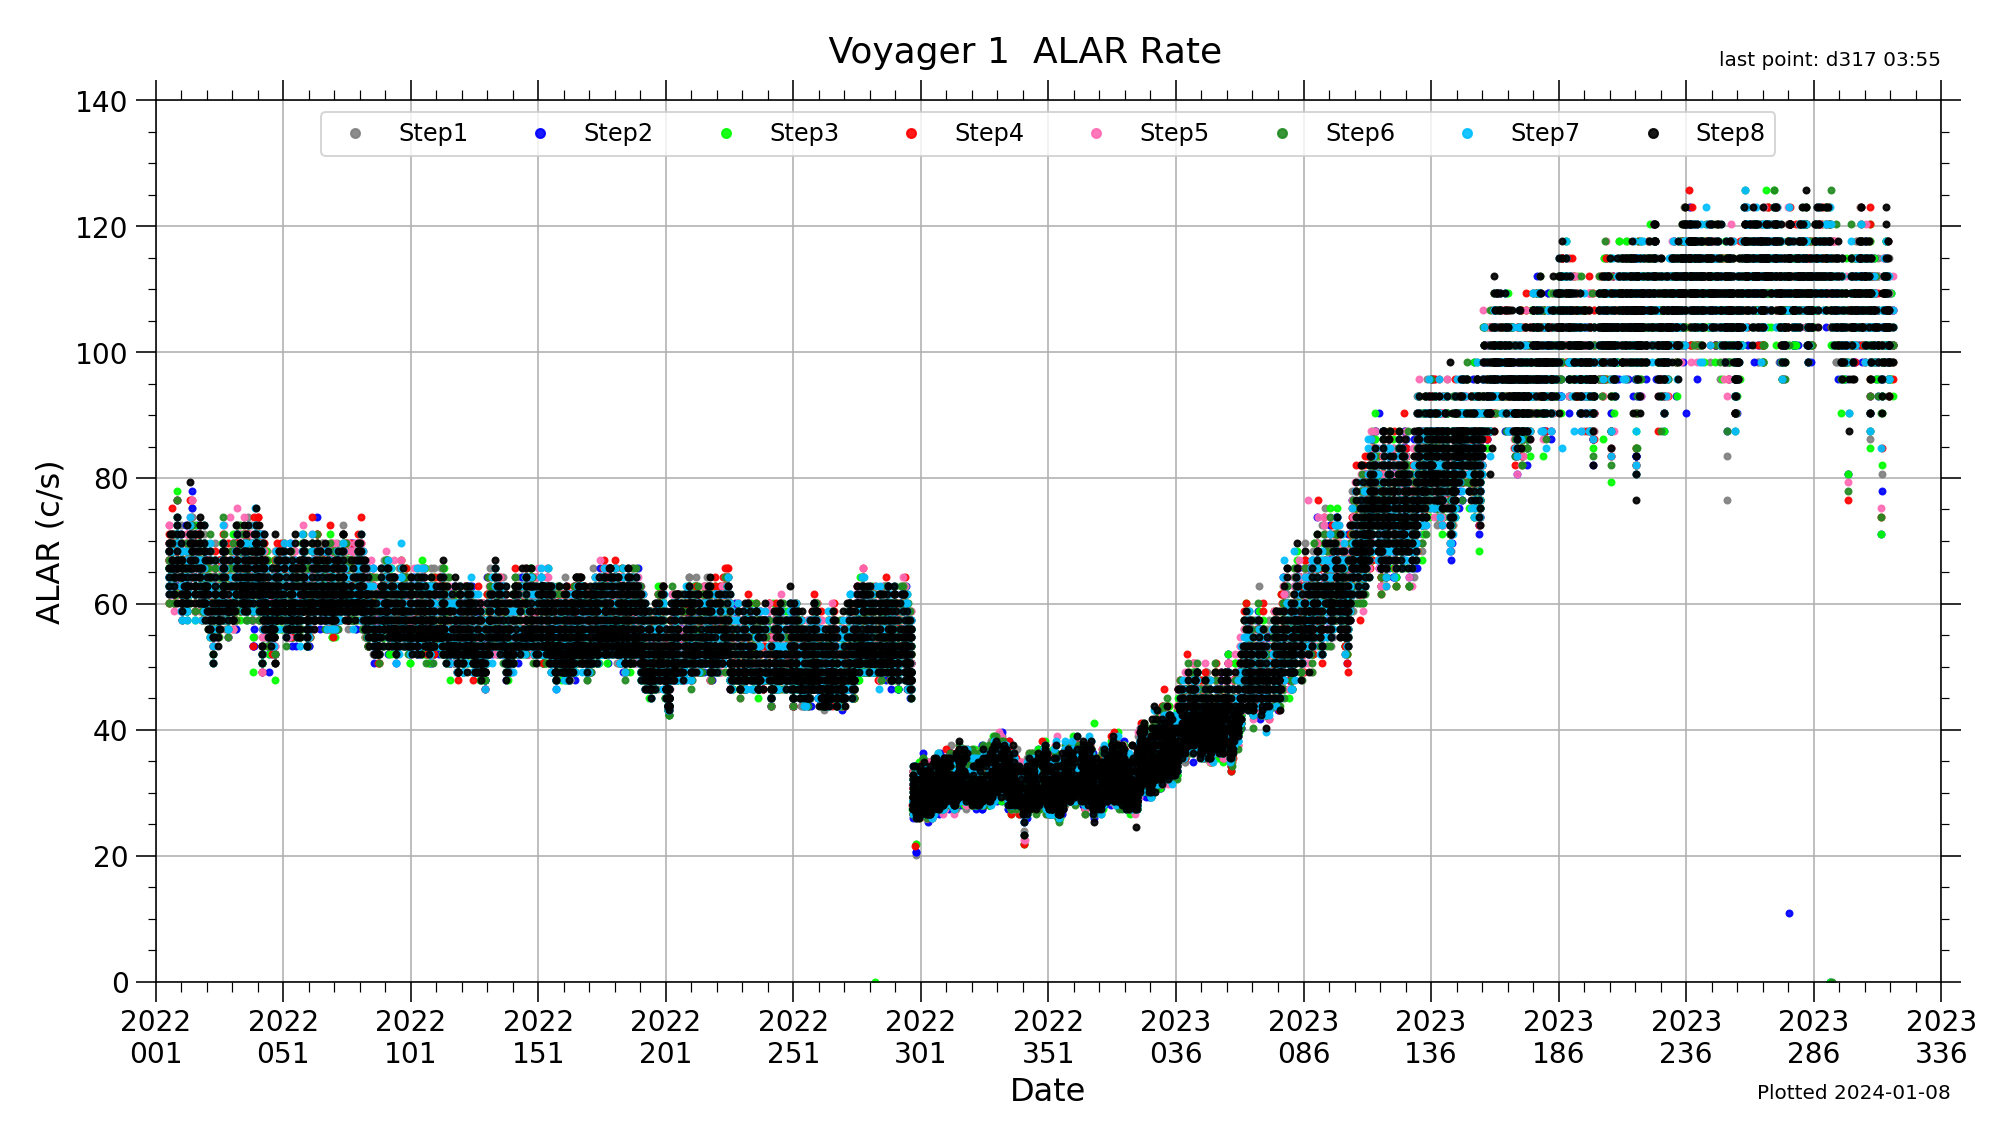
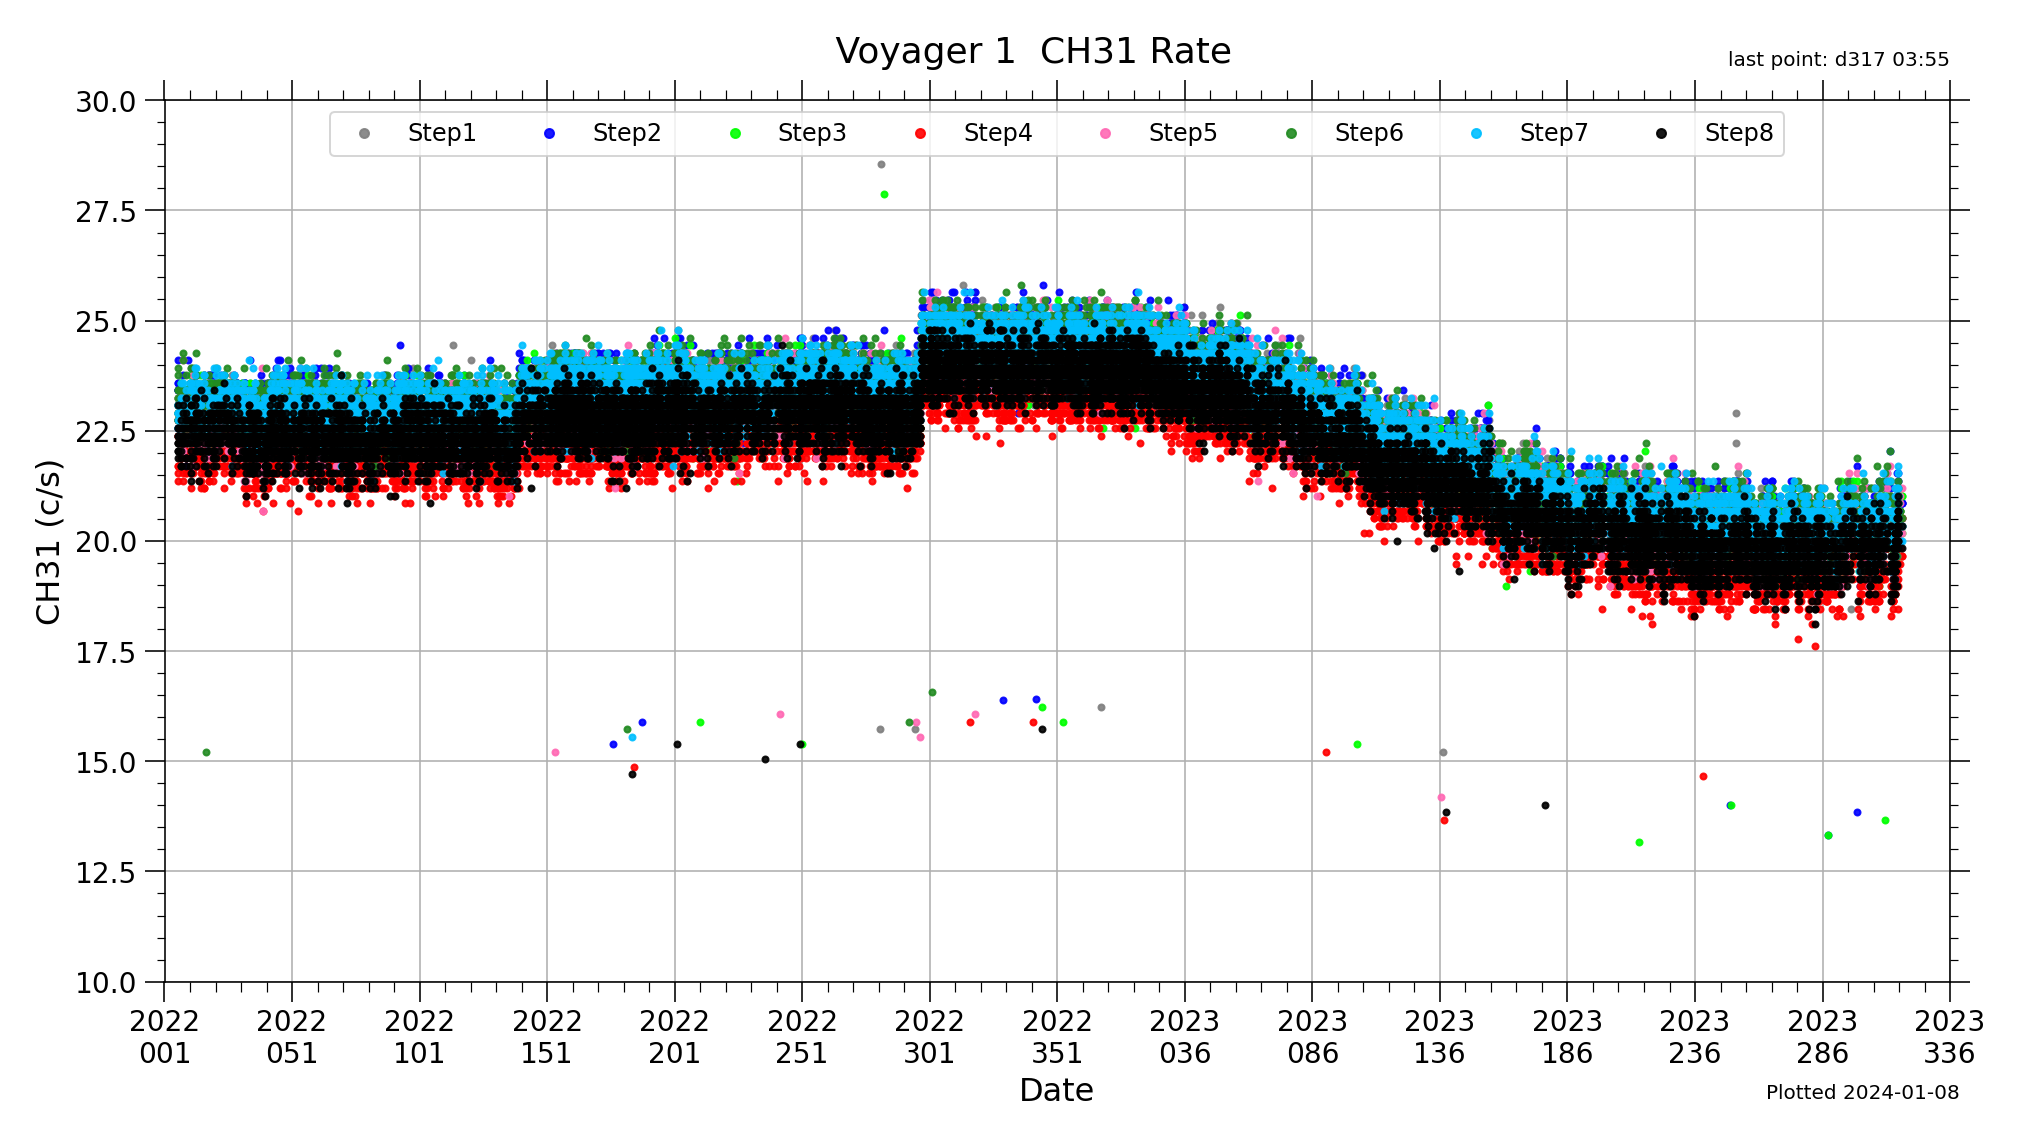
Voyager 1 temperature plot from Stu

Excel file, last updated May 29, 2024, containing pha, rate and mrt header information from recent daily and weekly files.


On Jun 10, 2024, at 20:01, Douglas C. Hamilton wrote:
Tom et al.,
I agree with your conclusion, Tom, that we should stand pat for now.
I have been thinking about how to recover some composition information from the low energy end of LEPT. Since D2 is off, we won't have 2-D information. There are four rates that in theory could be useful:
1. Ch 39 E0A (E0B) (E2) nominally 0.075-0.150 MeV/nuc alphas
2. Ch 38 E0B (E0D) (E2) nominally 0.047-0.125 MeV/nuc medium nuclei
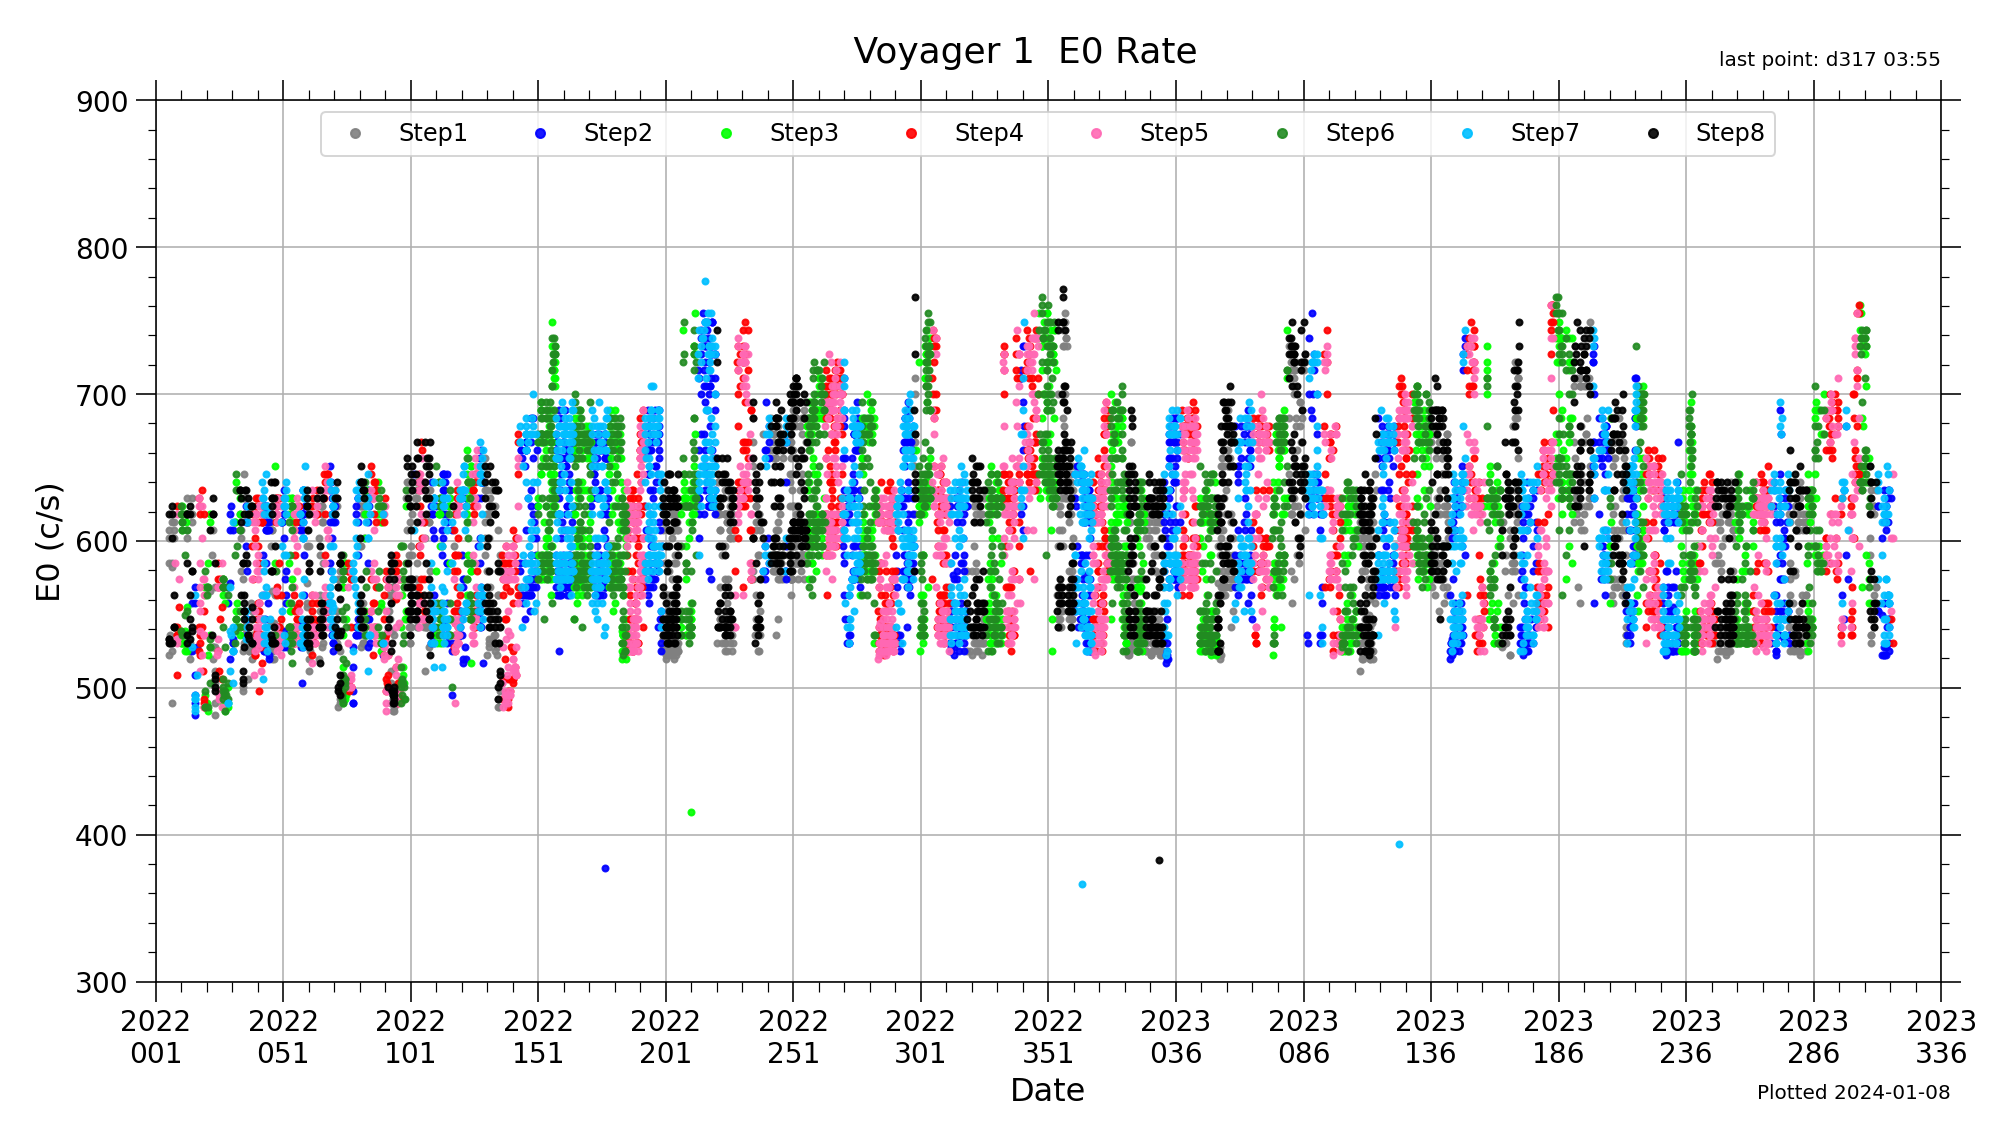
Since the E0 singles rate appears to be well behaved after FDS recovery, I thought this might be the best chance. However, my first attempt to examine Ch39 and Ch38 with VMIDL, shows Ch39 dropping after the anomaly to Ch38 levels before the problem and Ch 38 disappearing as if there had been a large gain loss in D0 such that the alpha pulses fell below E0A and medium nuclei fell below E0B and are now being counting in Ch39.
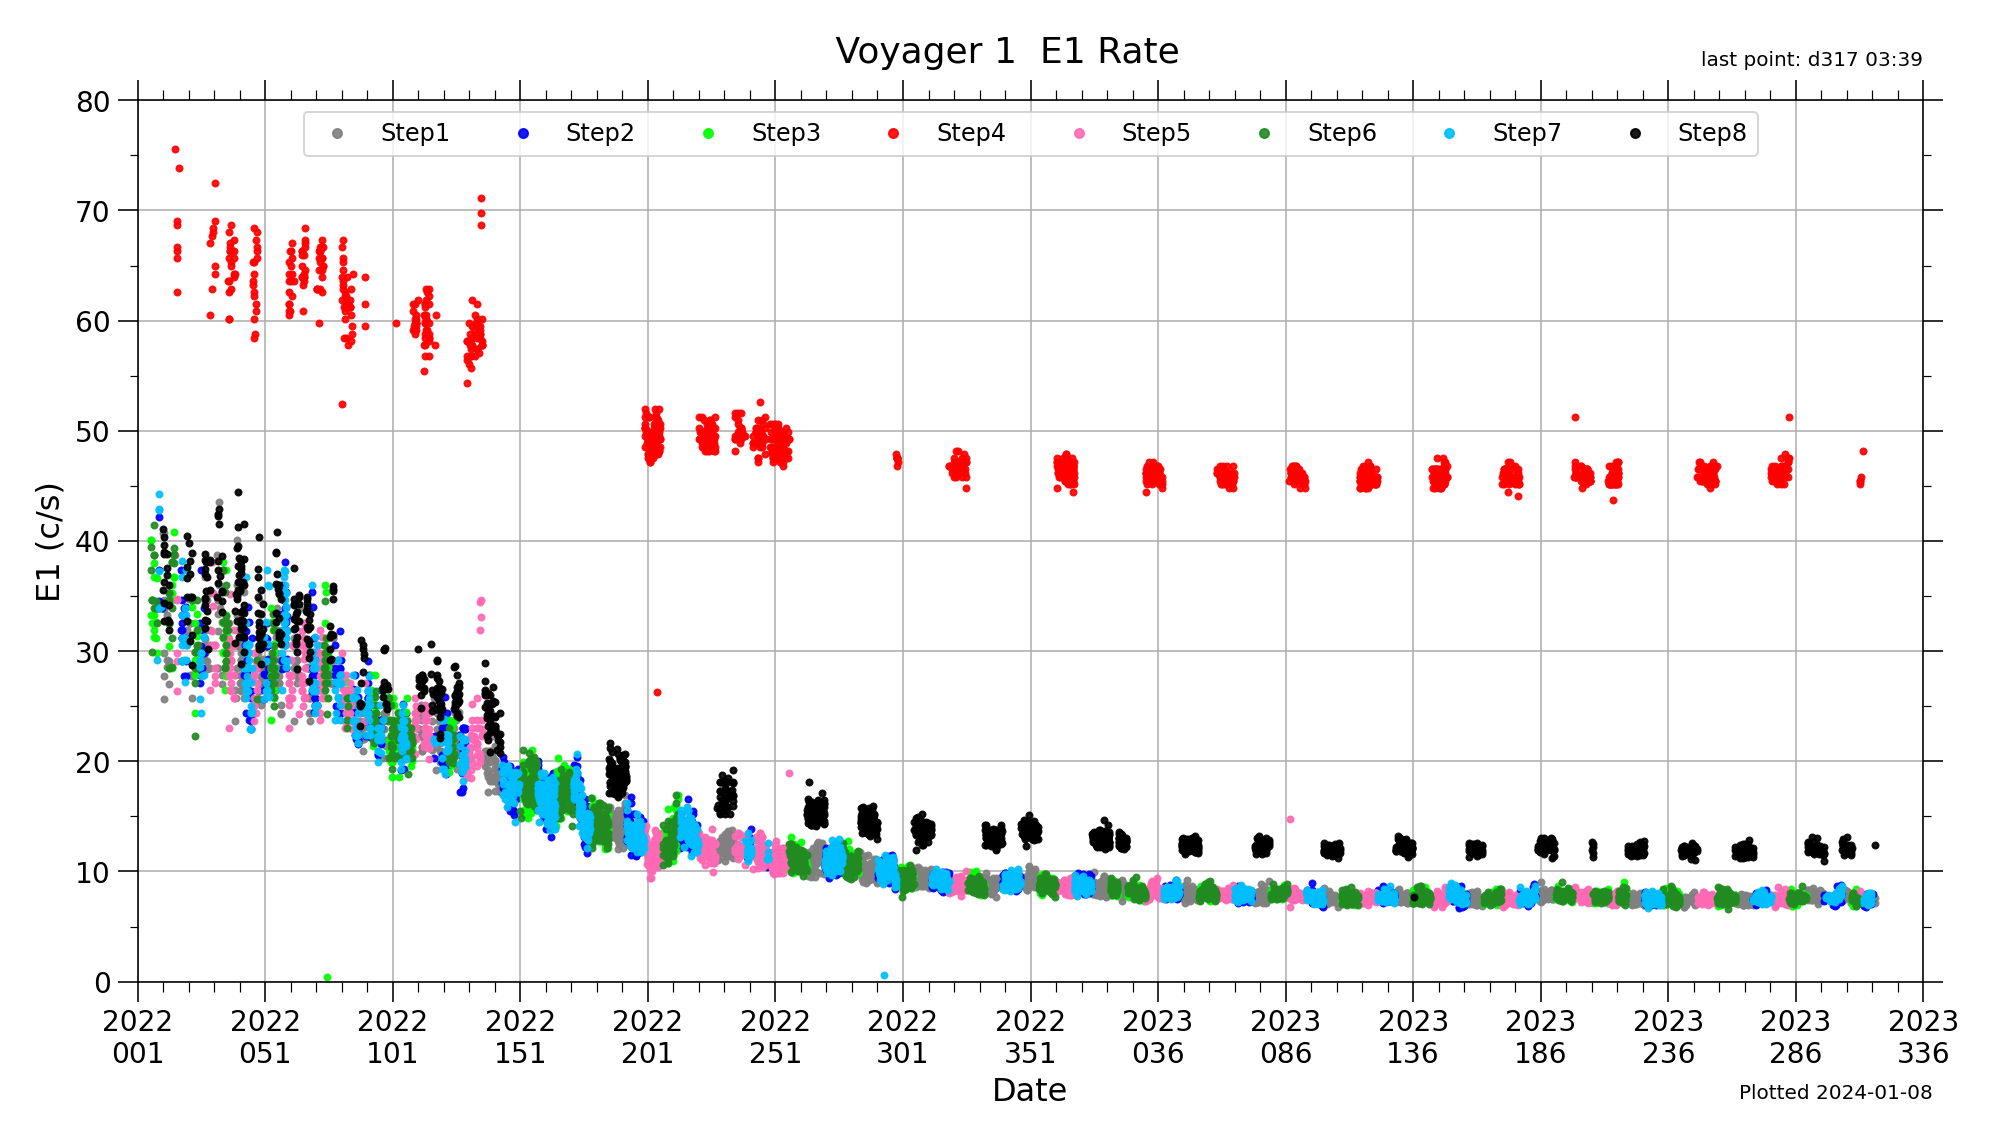
E1 singles show a noisy detector ~40,000 c/s. As far as I know, E1 sums counts from D1a and D1b, but I could be wrong. There are two singles rates from separate fast electronics connected to D1a only.
3. D1F1 (Ch46) nominally 0.15-1.1 MeV/nuc alphas
4. D1F2 (Ch47) nominally 0.13-10 MeV/nuc medium nuclei
These two rates are consistent before and after the FDS anomaly. D1F2 counts at a low rate of ~5 x 10^-4. D1F1 is a bit flakey with two different values: mostly ~2 x 10^-3 but with a second more noisy group of values ~2 x 10^-2. That behavior persists after recovery.
Since D1F1 and D1F2 are consistent across the anomaly, one might conclude that D1b is the noisy detector and turning it off could be of some benefit. However, since D1F1 and D1F2 are already "nominal" after recovery, it's not clear what turning off D1b would accomplish. Also the "bad behavior" of D1F1 may imply it's not useful anyway.
More study and comparison with V2 (only for D1F1 and D1F2 since D0 is off on V2) are needed.
Doug
