| |
Fundamental TechnologiesVoyager LECP Pages |
How to Splice Big Data Files
The following is a description of how to view graphs of multiple cor data on the same axes. There are certainly ways other than those described here to do this, but if you haven’t got the foggiest idea how to get started then this should help.
First, before one starts actually graphing anything one should get acquainted with the data. Please see the following documents, as they describe each column's coordinate reference frame, the data label, and the units: http://voyager.ftecs.com/sedr/attachment-E.html
Special Note: Often these data sets can be in excess of 10,000 but always less than 30,000 lines long. Depending on computer processor speed and available RAM, Microsoft Excel may behave in a sluggish manner while attempting to graph multiple files of these types.
In addition to this document, an example file has been placed in the same directory.
When analyzing multiple similar files it is helpful to utilize the multiple tabs available in Microsoft Excel.
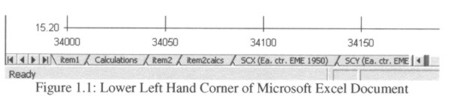
For example, in figure 1.1 above, the tab labeled “item1” contains the data set for the first item of comparison, such as some reference data. The tab labeled “calculations” contains links to the columns from tab “item1” which need to be graphed. Tab “item2” contains data for the second item of comparison and “item2calcs” contains the columns in “item2” which need to be graphed. The graphs are then made from the columns in “calculations” and “item2calcs.”
This is done so the data in “item1” and “item2” can be replaced with new data and the graphs do not have to be rebuilt but simply relabeled according to the attributes of the new data.
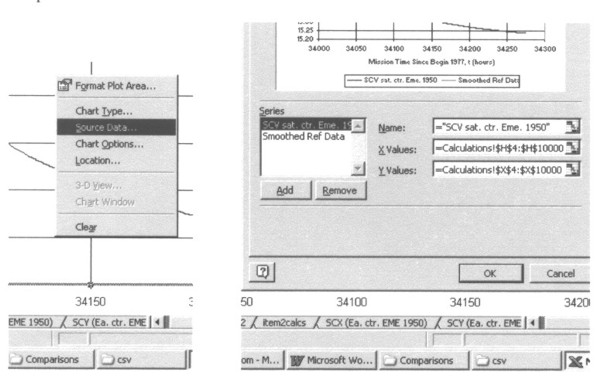
Once the graphs are set up, initializing or replacing data is as easy as:
Tabs for additional items of comparison such as “item3” to “item#” could be added so long as the file size does not exceed available RAM.
When setting the graph attributes: be generous with the number of lines graphed. This may make some files take up more memory than they need to, but it may save much time if many files are to be compared.
Return to Voyager LECP Data Analysis Handbook Table of
Contents.
Return to Fundamental Technologies Home Page.
Last modified 7/7/05, Tizby Hunt-Ward
tizby@ftecs.com